
Proving AI ROI in Engineering: A Measurement System That Survives a Finance Review
Ask an engineering leader whether AI is paying off, and the evidence offered is usually the same two things: a dashboard showing how many seats are active, and a survey in which most developers say they feel faster. Neither is evidence of return. One measures whether the tools are being used. The other measures how people feel. The question a finance partner is actually asking is different: what did we get for this spend, and how do you know? This post is about building the system that can answer both halves of that question, at the strength the evidence really supports.
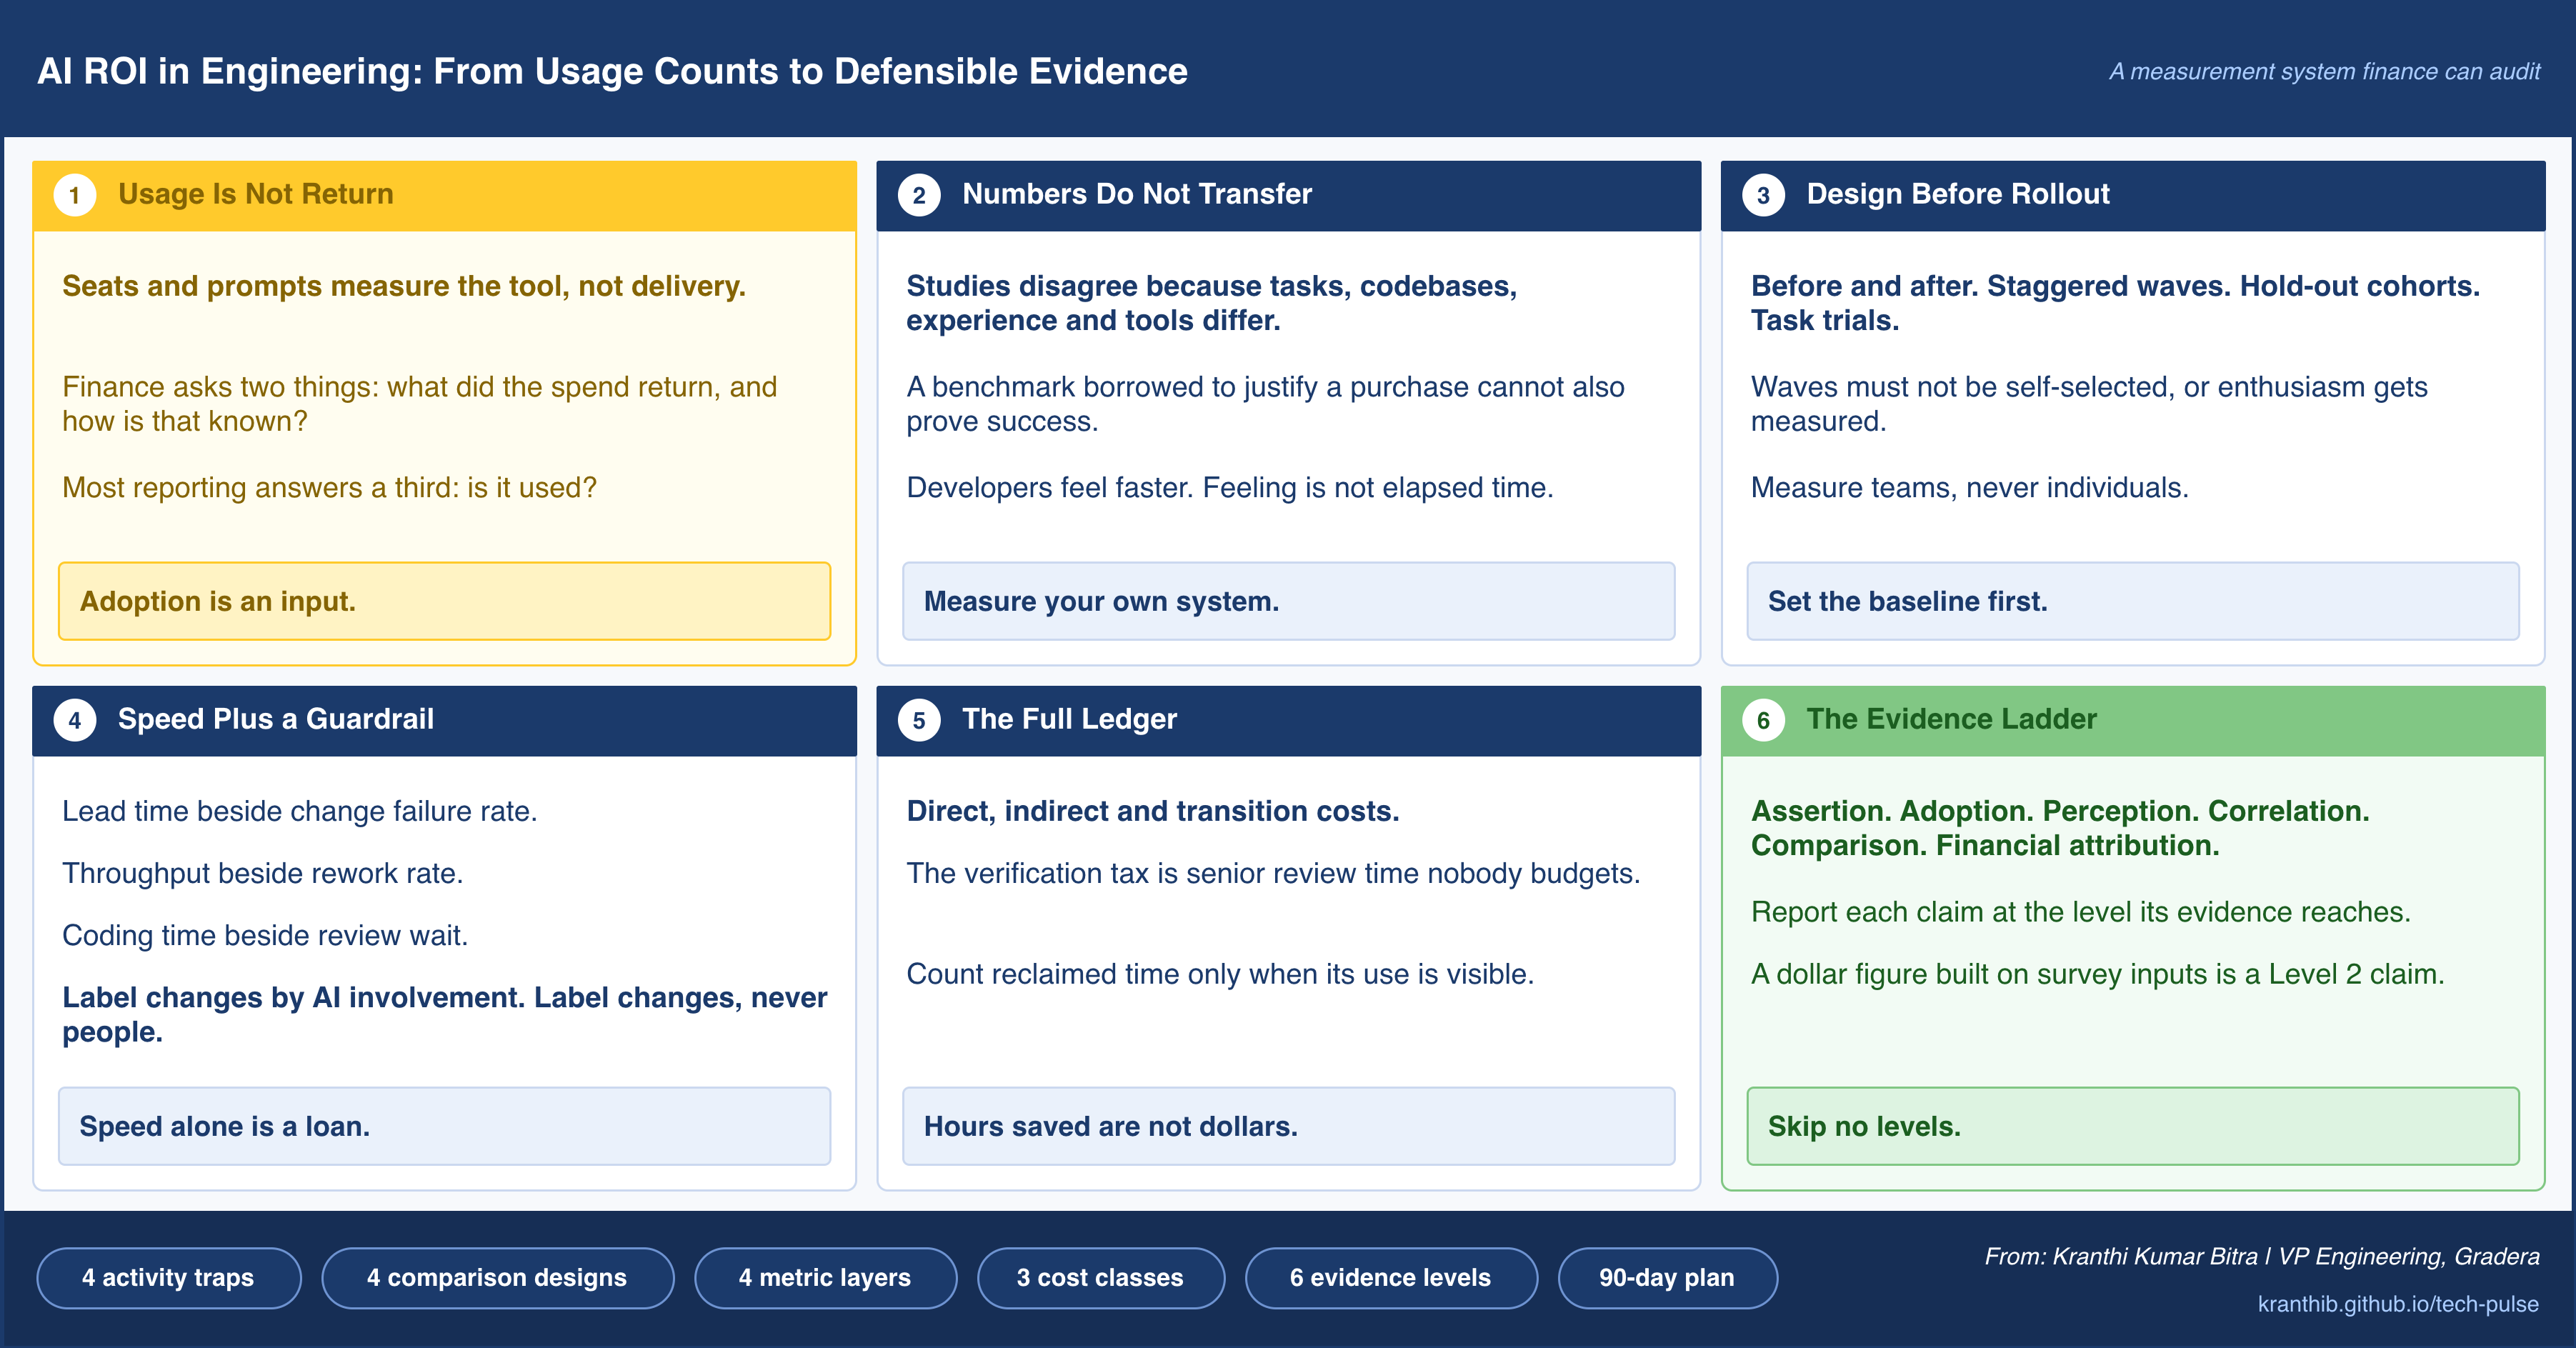
The Question Finance Is Actually Asking
For a while, AI tooling in engineering lived on an innovation budget, and innovation budgets are forgiving. Nobody asks an experiment to prove a return. That period is ending. Seat licenses have become a line item, consumption-based agent costs vary month to month, and renewal conversations now include a person whose job is to ask what the organization received in exchange.
That person is asking two questions, and they are different in kind.
The first is what did we get? It is a question about outcomes: features delivered, incidents avoided, cycle time reduced, capacity redeployed to work that mattered. The second is how do you know? It is a question about evidence: whether the change would have happened anyway, whether it was caused by the tools, and how much of the reported effect would survive scrutiny.
Most engineering reporting answers neither. It answers a third question, is it being used?, because usage is the only thing the tools measure about themselves. Seats activated, prompts sent, suggestions accepted, and lines generated are all facts about the tool. None of them is a fact about delivery.
There is a real cost to getting this wrong in either direction. The leader who arrives with no numbers loses the argument by default. The leader who arrives with confident numbers that later collapse loses something harder to recover: the credibility to make the next investment case. The goal is therefore not the biggest defensible number. It is a set of claims, each stated at exactly the strength its evidence supports, backed by a system that keeps producing them.
Why Published Numbers Do Not Transfer
The public evidence on AI and developer productivity is contradictory, and understanding why is the foundation of everything that follows. Some controlled studies report large speedups on bounded tasks. Others report that experienced developers working in mature, familiar codebases finished more slowly with AI assistance while believing they had finished faster. Industry telemetry from large samples of teams shows more code produced and more pull requests opened, alongside longer review queues and, in some cases, worse delivery stability.
These are not contradictions. They are measurements of different things. The results depend on the type of task, the maturity and size of the codebase, the experience of the developer, the generation of the tools, and, most importantly, on what was measured. Time to complete an isolated task, output per developer, and throughput of the whole delivery system are three different quantities, and a tool can move them in three different directions at once.
Two consequences follow for anyone building a business case.
The first is that importing a published benchmark into your own forecast is borrowing someone else’s baseline. A number drawn from a different codebase, team profile, and tool generation tells you what was possible somewhere, not what you will see. It is fine as a hypothesis. It is not a forecast, and it is certainly not a result.
The second is that developer perception, while real and worth capturing, cannot stand in for measurement. Developers who feel faster are reporting a genuine experience: less friction in drafting, fewer blank-page moments, quicker first attempts. But the feeling of speed and the elapsed time to a finished, reviewed, deployed change are different quantities, and the two have been observed to diverge in both directions. A survey is a useful signal about experience and a poor instrument for productivity.
Put those together and the conclusion is uncomfortable but clarifying. You cannot know your return from anyone else’s data. The most valuable output of a measurement program is not a single headline number. It is knowing which of your own teams, task types, and codebases benefit, which do not, and why.
Most Teams Get This Wrong: They use a vendor benchmark to justify the purchase, then use the same benchmark to declare success. A number that was borrowed to make the forecast cannot also serve as the result.
Four Traps of Activity Metrics
Most disappointing measurement programs fail in the same four ways. Each trap involves a metric that is easy to collect, looks like evidence, and quietly measures something other than value.
Adoption is not impact. Active seats, weekly users, and prompt volume tell you how widely the tool has spread. They say nothing about whether delivery changed. A tool used by everyone and a tool used by no one can produce identical delivery outcomes. Adoption belongs in the picture as a precondition, not as a result.
Output is not outcome. Suggestions accepted, lines generated, commits, and pull requests are all measures of output, and AI makes output cheap. When the marginal cost of producing code approaches zero, the volume of code stops being a signal of value and starts being a signal of appetite. Rising output can even be a warning, because every additional change is something a person must eventually review, test, and maintain.
Local speed is not system throughput. Delivery is a pipeline, and a pipeline moves at the speed of its slowest stage. If AI makes the writing stage faster while review, testing, integration, and release stay the same, the constraint does not disappear. It moves. Work now waits in a different queue. A faster author in front of an unchanged review process produces a longer line at the reviewer’s desk, and the organization can feel busier while shipping the same amount.
Self-report is not measurement. As noted above, felt productivity is a valid signal about experience and an unreliable estimate of elapsed time. Surveys are useful for finding friction and for understanding why a metric moved. They are weak evidence that it did.
Behind all four sits a familiar hazard. Once a measure becomes a target, it stops being a good measure. That principle applies to engineering metrics with unusual force in the AI era, because gaming has become nearly free. If pull request count is rewarded, pull requests appear. If generated lines are tracked, lines are generated. The defense is to choose measures that are difficult to inflate without real delivery: completed work reaching production, end-to-end lead time, and rework that follows a change. Those are hard to fake because they depend on what happens after the code is written.
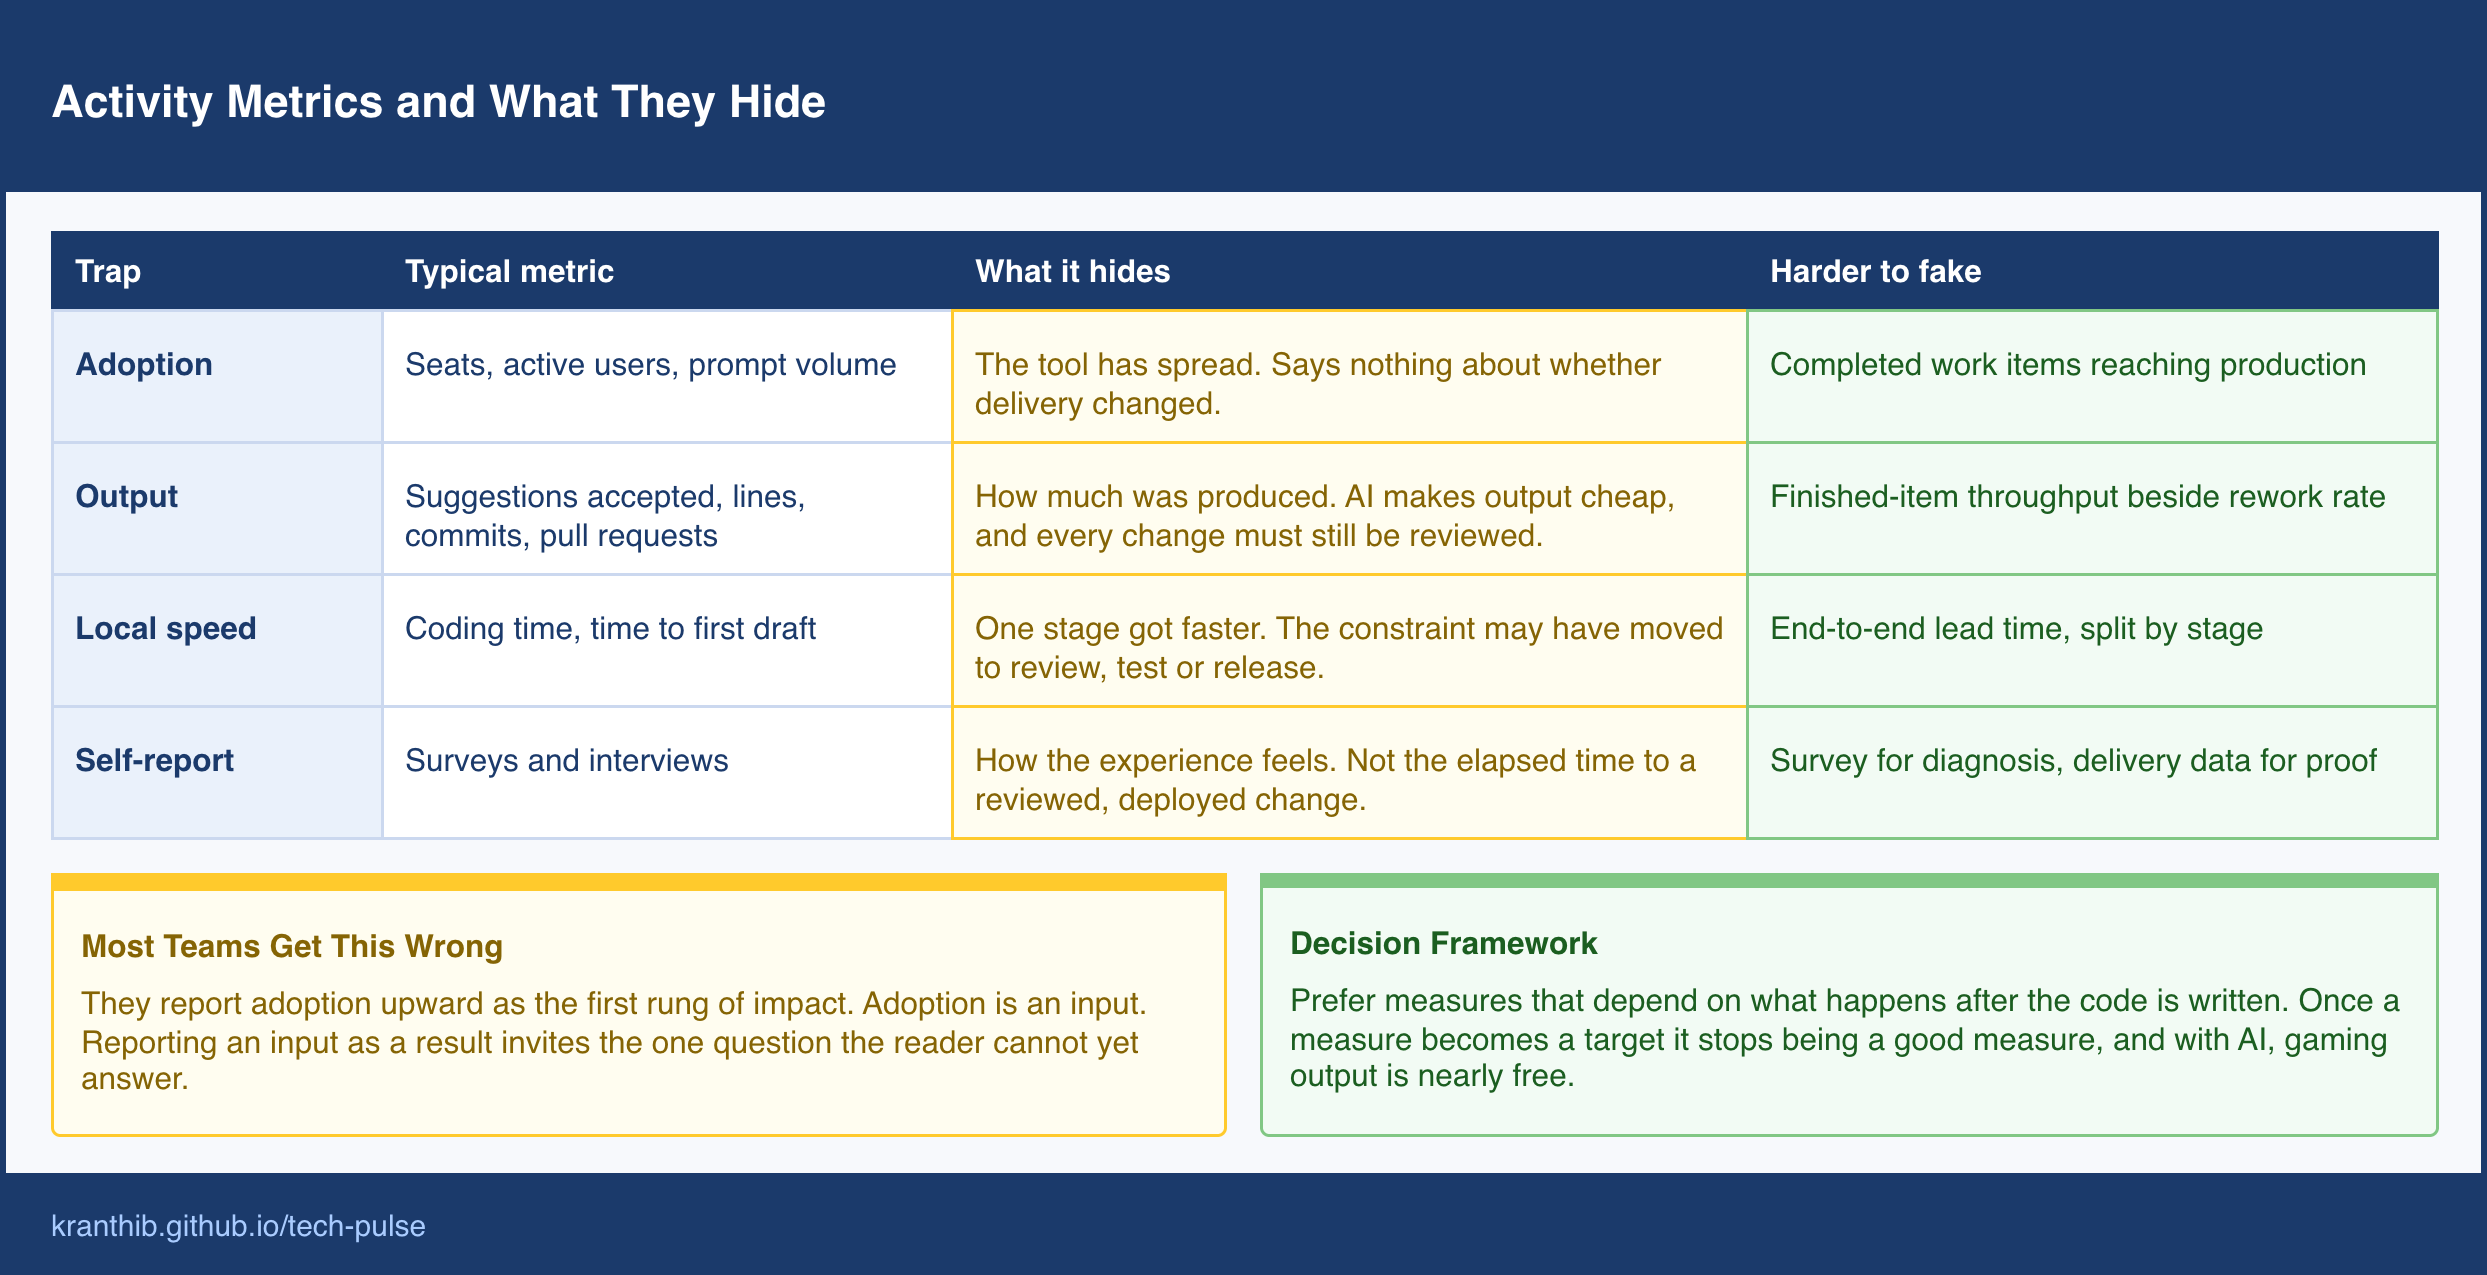
Most Teams Get This Wrong: They treat adoption as the first rung of impact and report it upward as progress. Adoption is an input. Reporting an input as if it were a result invites exactly the question the reader cannot yet answer.
Design the Measurement Before the Rollout
The single most avoidable mistake in AI measurement is starting to measure after the tools are already everywhere. Without a baseline, or a group that did not get the tools, there is nothing to compare against, and every improvement claim rests on memory. The design of the comparison should be decided before rollout, and there are four designs worth knowing, ordered roughly by rigor.
Before and after. Record delivery metrics before adoption and compare them to the period afterward. This is the cheapest option and the weakest, because everything else also changed: the roadmap, the staffing, the season, the other tools. A before-and-after result is a starting observation, not a finding.
Staggered rollout. Adopt in waves, and compare teams that have adopted with teams that have not yet, over the same calendar period. Because both groups experience the same organizational weather, this design controls for most time-based confounders, and it costs almost nothing extra, since most organizations roll out in waves anyway. The critical requirement is that wave assignment not be self-selected. If the most enthusiastic teams go first, the comparison measures enthusiasm.
Hold-out cohorts. Deliberately keep a comparable set of teams without the tools for a bounded period. This is the strongest team-level design and the most expensive, because it delays benefit for the hold-out group and can be politically difficult. It is worth it when spending is large and the decision to scale hinges on the answer.
Task-level trials. For bounded, repeatable kinds of work, such as dependency upgrades, test generation, or migrations of a standard pattern, compare completion on comparable tasks with and without assistance. This produces the strongest evidence for narrow claims and says little about the whole system.
Five practical rules make any of these designs work.
Measure at the level of the team, or the team and the type of work, never the individual. Individual measurement is noisy and corrosive. It invites gaming and fear, and it hides the system effects that actually determine return.
Fix the definitions before collecting data. Decide what counts as a completed work item, what window defines rework, and how lead time is bounded, and then leave them alone.
Run the baseline long enough to include normal variation, including at least one full release cycle.
Record confounders as they happen: reorganizations, major incidents, roadmap shifts, staffing changes. A result without its context is not interpretable later.
State in advance what result would cause you to stop, to continue, or to scale. Deciding the thresholds after seeing the data is the fastest way to convince yourself of whatever you hoped.
Perfect experimental design is rarely available inside a working company, and it does not need to be. A staggered rollout with fixed definitions and labeled changes captures most of the value of a formal trial at almost none of the cost.
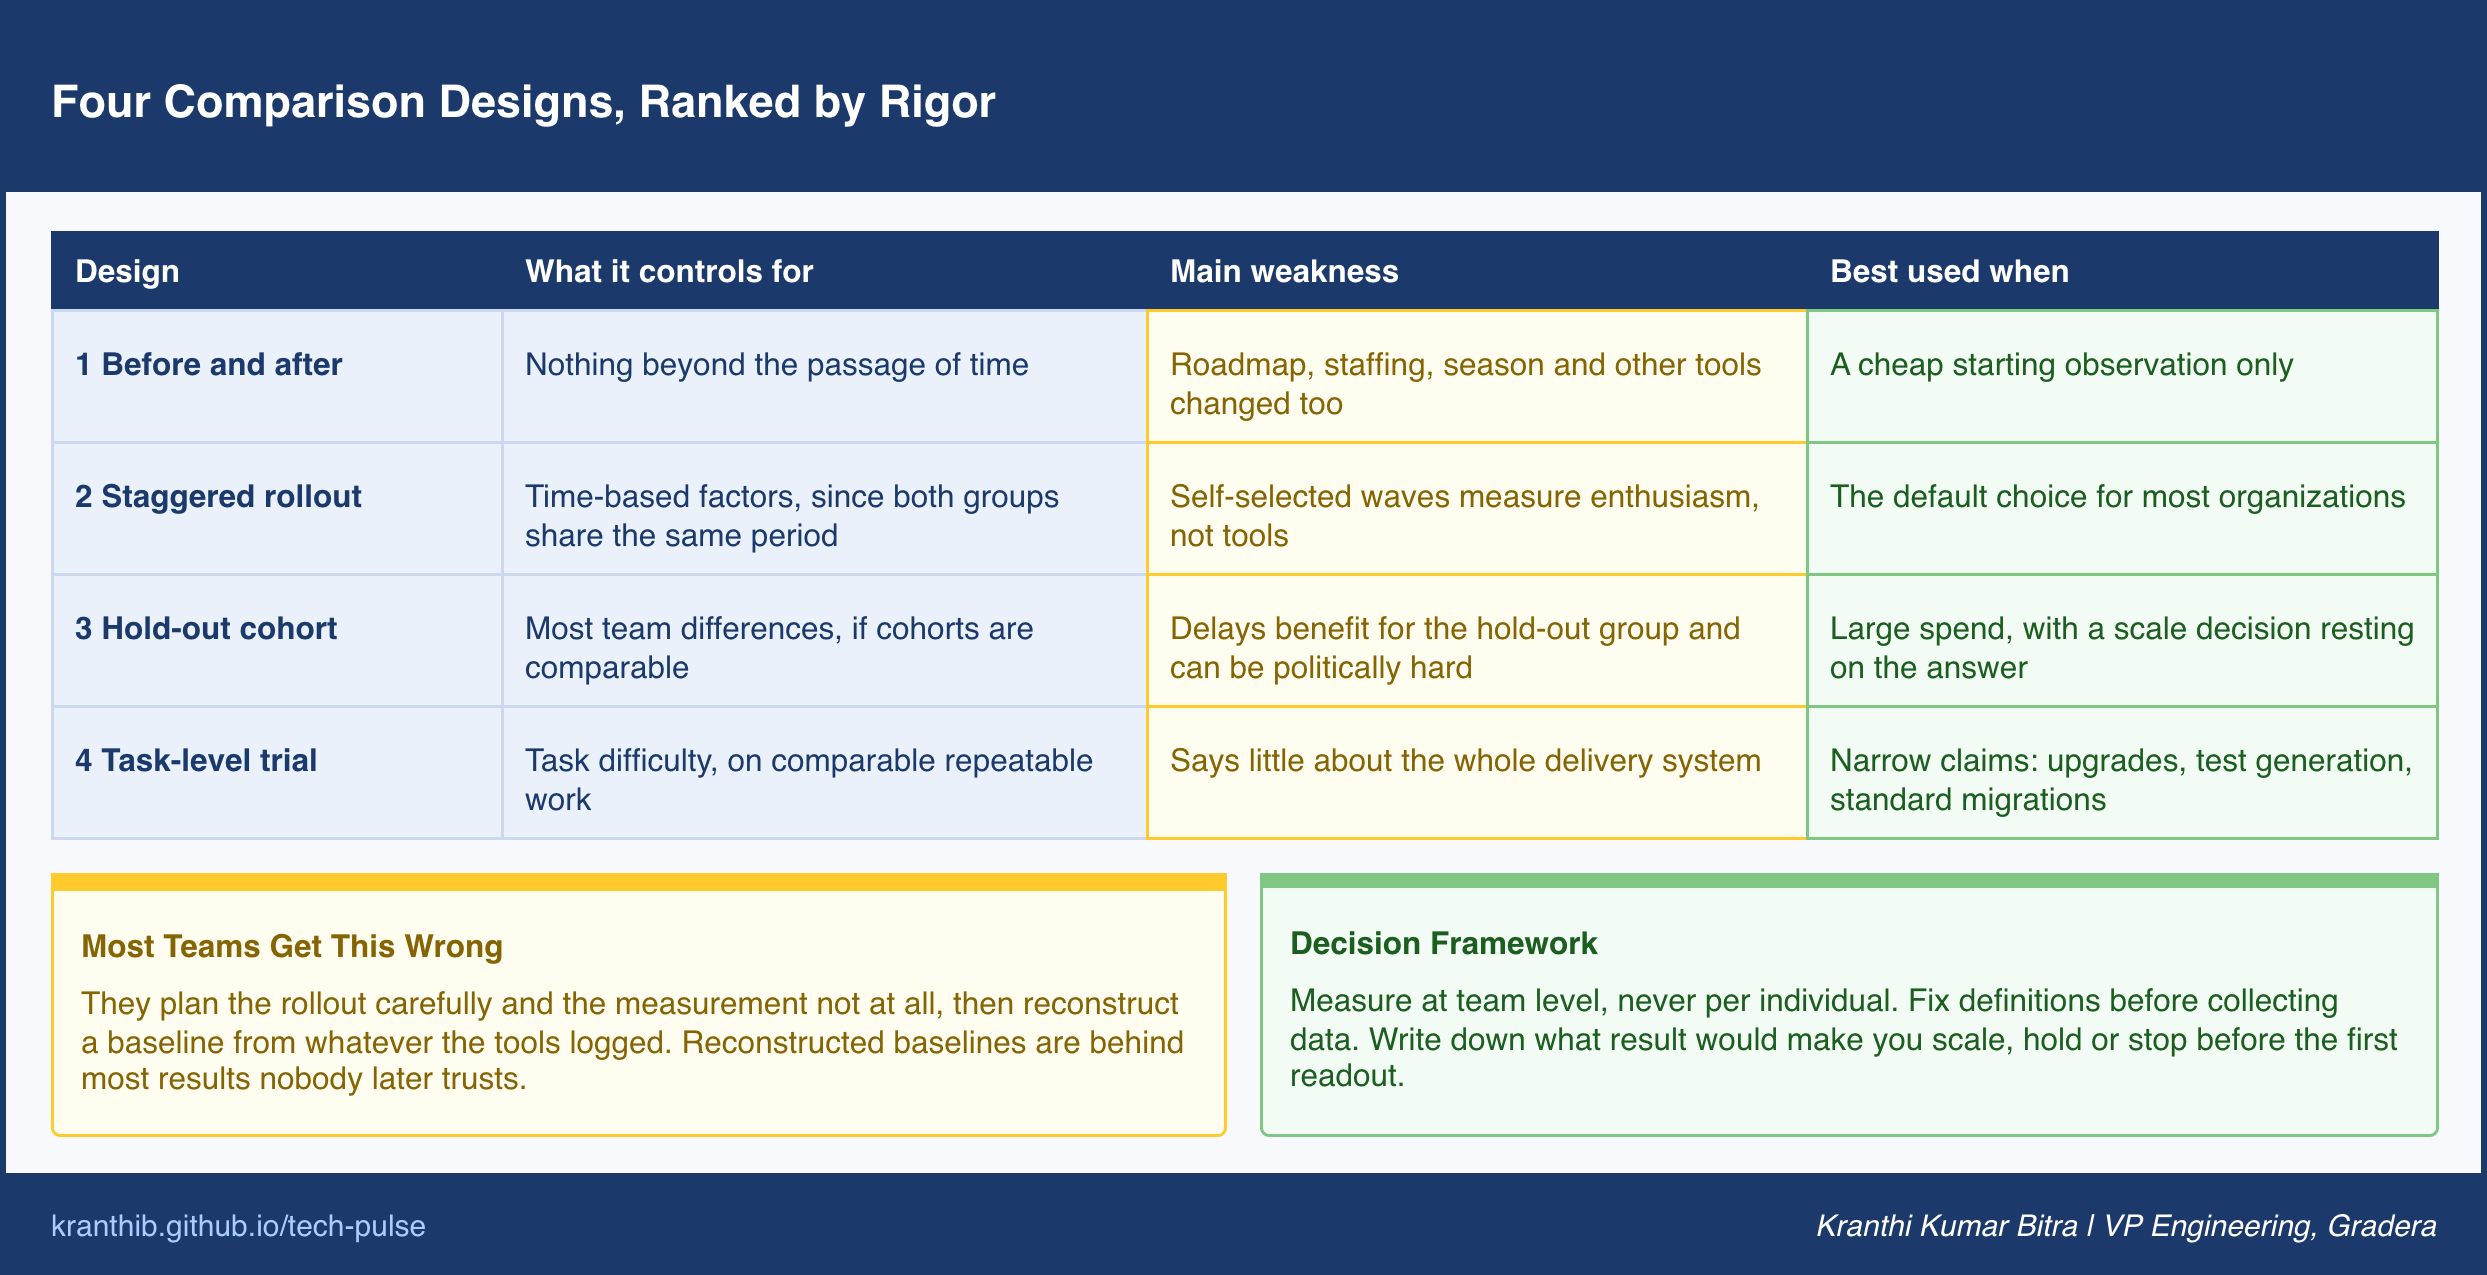
Most Teams Get This Wrong: They plan the rollout carefully and the measurement not at all, then try to reconstruct a baseline from whatever the tools happened to log. Reconstructed baselines are the source of most results nobody later trusts.
The Metric Stack: Speed Always Travels With a Guardrail
Once the comparison is designed, the question becomes which metrics to compare. The answer that holds up best is a small stack in four layers, with one rule governing how they are reported: every speed metric is published next to a quality metric that would reveal if the speed was borrowed. Speed with no guardrail is a loan. It looks like profit until the repayment arrives as rework, incidents, or a review queue that never empties.
The flow layer describes how quickly finished work reaches production. The most useful measures are lead time for changes from first commit to production, throughput of completed work items (not commits, which AI inflates), and deployment frequency. Pull request cycle time is valuable when split into its parts: time until the first review, duration of review, and idle waiting time between rounds. That split is where the constraint usually reveals itself. If coding time fell but time to first review rose, the gain was transferred, not created.
The quality layer describes what happened to the work after it shipped. Change failure rate, incident rate, escaped defects, and rework rate belong here. Rework rate deserves particular attention: the share of changes that touch the same code again within a defined window. It is difficult to fake and it captures the delayed cost of code that was accepted quickly and understood shallowly.
The cost layer covers what the organization spent to obtain the result, and it is broad enough to have its own section below.
The experience layer captures developer-reported friction, cognitive load, and satisfaction. It is context, not proof. Its job is to explain the other layers: why review duration rose, where the tools help and where they get in the way, which task types are painful. Read it as diagnosis, not as a scorecard.
The pairing rule makes the stack usable in practice. Lead time is reported beside change failure rate. Throughput is reported beside rework rate. Pull request volume, if reported at all, is reported beside review wait time. When a speed metric improves and its guardrail worsens at the same time, the report says so plainly, because that divergence is exactly the pattern that separates real return from displaced cost.
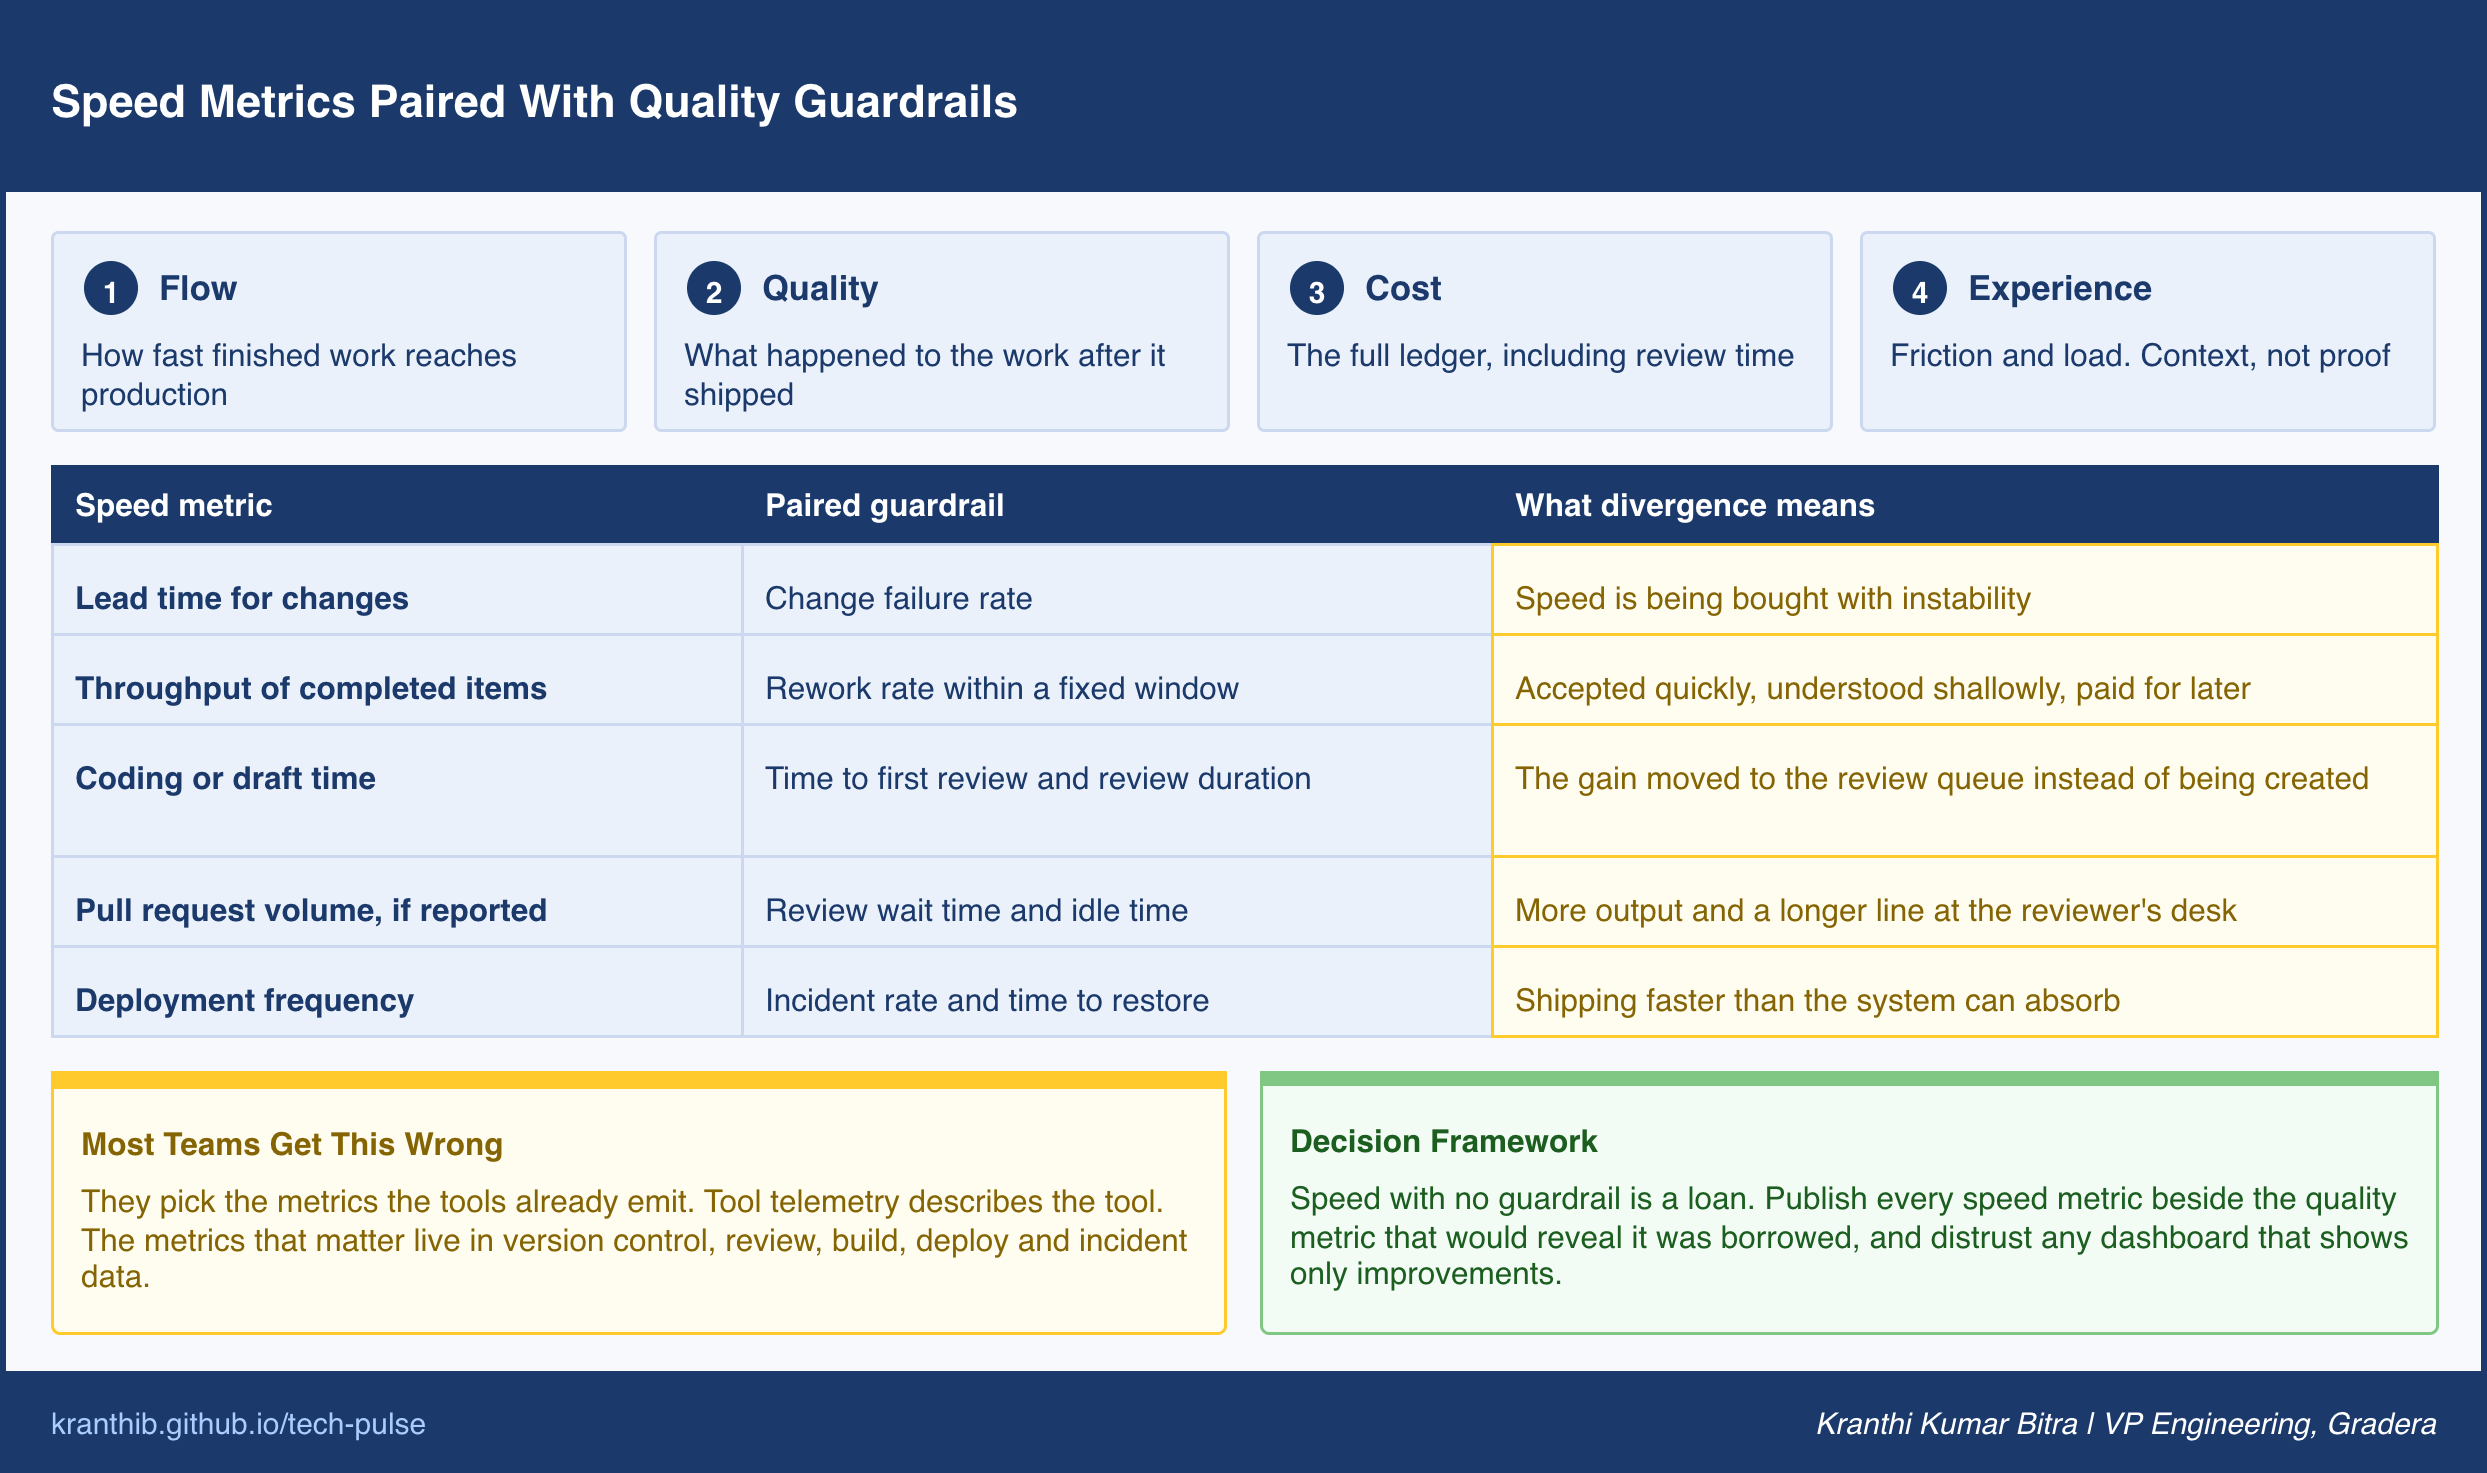
A useful habit is to distrust any dashboard that shows only improvements. Real systems have trade-offs. A measurement program that never surfaces one is usually measuring the wrong things or hiding them.
Most Teams Get This Wrong: They pick the metrics that the tools already emit. Tool telemetry is convenient, but it describes the tool. The metrics that matter live in the delivery system, in version control, review, build, deploy, and incident data, and connecting those sources is the real work.
Traceability: You Cannot Segment What You Cannot Label
The stack above compares teams and periods. The next step up is comparing changes: how do pull requests with heavy AI involvement differ from those without in cycle time, rework, and defects? That comparison is only possible if the system knows which changes had AI involvement, and in most organizations it does not.
Without labels, every analysis is an average across everything. An average across AI-assisted and unassisted work can hide a tool that works brilliantly on one kind of change and badly on another. It also makes incidents harder to investigate, because nobody can quickly say whether a defective change was drafted by a person, assisted by a tool, or authored by an agent.
The remedy is a lightweight, consistent way of recording involvement at the level of the change. A simple three-level scheme is enough to start: no AI involvement, AI-assisted (a person authored and used tools to help), and agent-authored (an agent produced the change and a person reviewed it). The label can be carried by a commit trailer, a pull request field, or a join between tool telemetry and pull request identifiers. Where agents operate under their own identities, the identity itself carries the label without additional effort.
Sampling audits keep the labels honest. Periodically inspect a random set of changes and check whether the recorded involvement matches what actually happened. Labels that are never audited drift toward whatever is easiest to record.
One cultural rule matters more than the technical mechanism: label changes, not people. The purpose of traceability is to understand the system, to learn where assistance helps, where it costs, and where review needs to be stronger. The moment the same data is used to rank individuals or to compare developers, the labels start to be avoided or falsified, and the measurement program loses the very signal it was built to collect.
Most Teams Get This Wrong: They plan to work out AI involvement later, from whatever the tools logged. Involvement that was not recorded at the time of the change cannot be reliably reconstructed, and the missing history is exactly the history the first serious readout will need.
The Full Cost Ledger
Most AI business cases are one-sided. The value side is enthusiastic and detailed, and the cost side is a license fee. A ledger that would survive finance review lists costs in three classes and value in three classes, and treats each honestly.
Direct costs are the visible ones: seat licenses, consumption-based inference or agent charges, platform and integration infrastructure, and security and compliance review of the tools themselves.
Indirect costs are the ones usually missing from the case. The largest is what can be called the verification tax: the additional time senior engineers spend reviewing, understanding, and correcting AI-produced changes. It does not appear as a line item anywhere, because it is absorbed into existing salaries, which is exactly why it is missed. Other indirect costs include enablement and training time, the maintenance of prompts, rules, and shared tooling, governance overhead, and the cost of incidents that can be traced to AI-involved changes.
Transition costs are the temporary ones. Adoption is rarely smooth. Teams spend time learning what works, pipelines need adapting, and review practices need redesigning. During that period, output can dip before it rises. That dip is a real cost of the program and belongs in the ledger, not in the excuses.
On the value side, there are three categories, and each carries a discipline of its own.
Capacity converted. Time reclaimed from drafting and boilerplate is the most commonly claimed benefit and the most commonly overstated. Hours saved are not dollars saved. Reclaimed time only becomes value when it is converted into something observable: more completed work items, a shorter roadmap, avoided hiring, or a backlog that finally moved. The rule is simple. Count reclaimed time as value only if you can point to what it was spent on.
Time to market. Faster delivery of a revenue-bearing or cost-saving change is worth the value of the period gained. This is real, but it should be tied to specific deliveries, not assumed in aggregate.
Quality cost avoided. Fewer escaped defects, faster detection, or reduced incident time have a financial value, but only when there is a baseline rate to compare against.
A short, illustrative calculation shows why the indirect side matters. Suppose assistance reclaims four hours per engineer per week in drafting. If review of that additional output consumes an extra hour and a half, and correcting accepted-then-reworked changes consumes another hour, the net gain is one and a half hours, not four. The organization did not lose. It captured about a third of the headline. A business case built on the four hours will look like a failure when the one and a half hours arrives, even though the program is working.
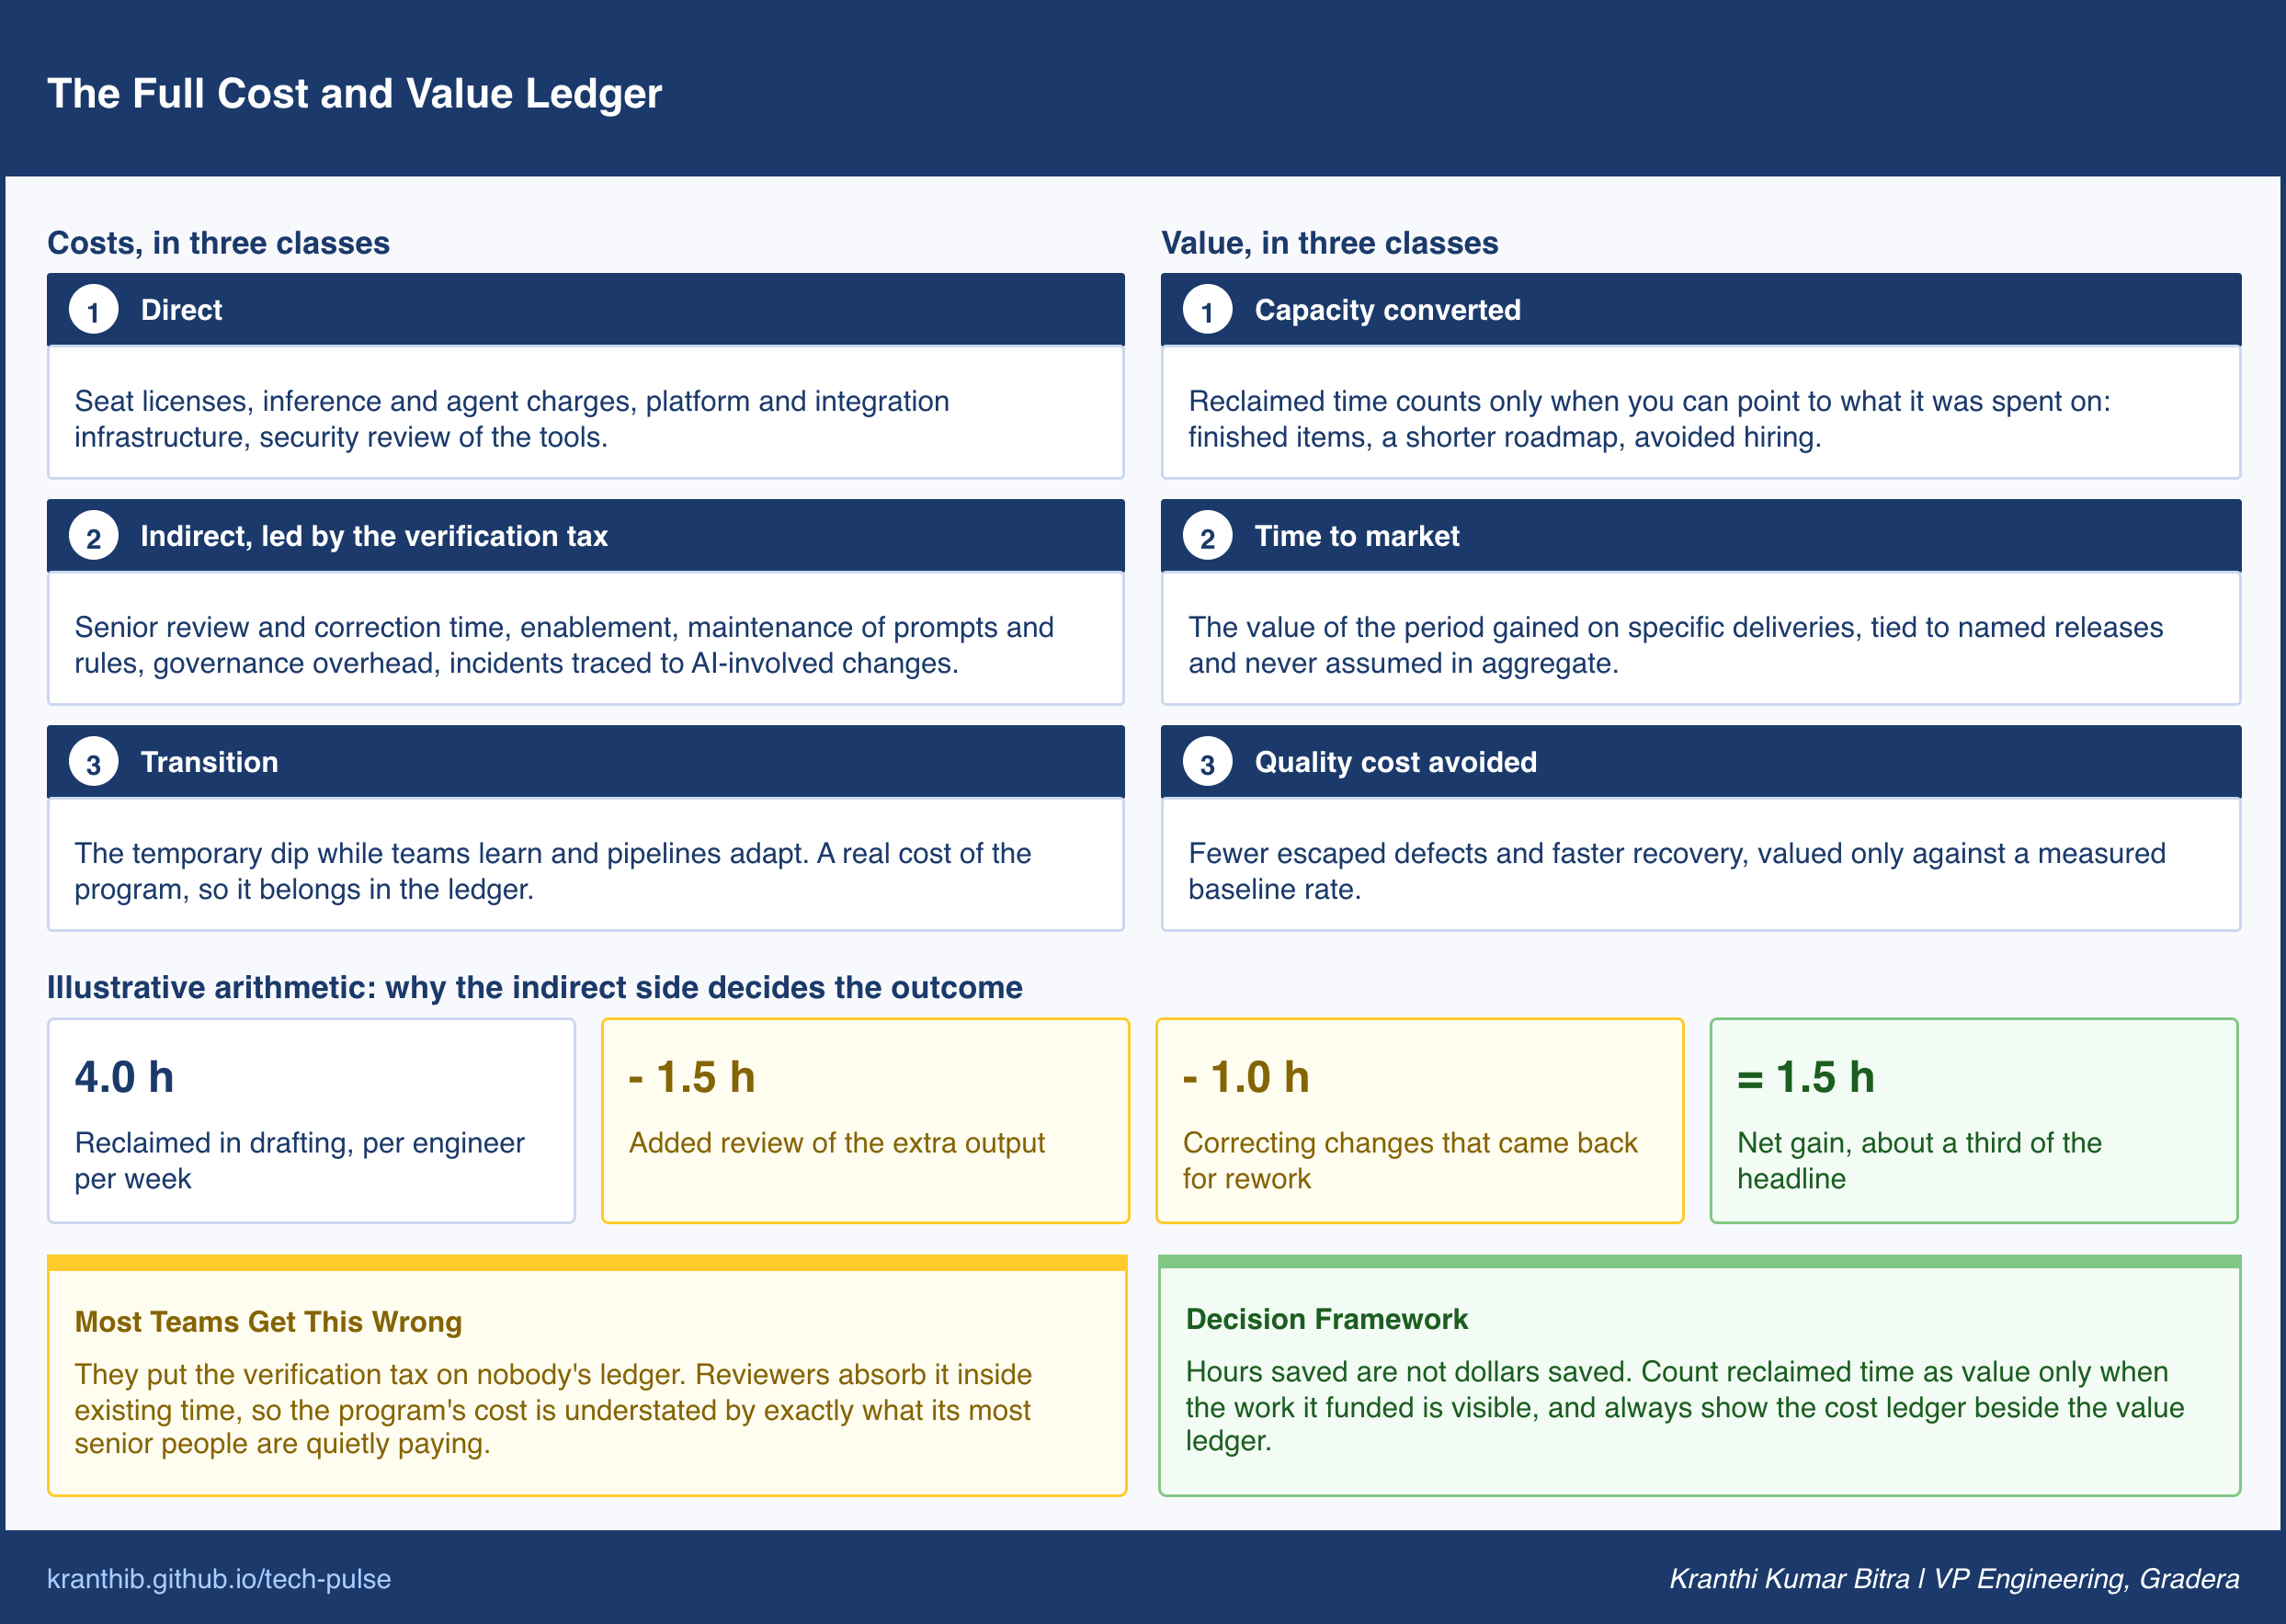
Most Teams Get This Wrong: They put the verification tax on nobody’s ledger. Because reviewers absorb it inside their existing time, it never appears in a budget, and the program’s cost is understated by exactly the amount its most senior people are quietly paying.
Reading the J-Curve Without Fooling Yourself
Adoption of a powerful new practice rarely produces a straight line upward. A common pattern is a dip first: teams learn, verification overhead appears, review processes strain, and delivery slows or becomes less stable before the surrounding system adapts and gains begin to compound. Analysts describe this as a J-curve, and the shape matters for measurement because it makes timing a source of error in both directions.
Evaluate too early, at the bottom of the dip, and you may cancel a program that was working. Evaluate at a lucky moment, or on the most enthusiastic teams, and you may crown a program that has not yet been tested. Either mistake comes from the same cause: the horizon for judgment was not fixed before the data arrived.
Three practices keep the J-curve from misleading you.
Set the evaluation horizon in advance, and do not borrow it. How long the dip lasts varies by organization, and the length is the most sensitive assumption in any return model. Published examples are illustrations, not forecasts. Decide your own horizon from your release cadence and your team’s maturity, write it down, and hold to it.
Define exit signals from the trough. Rather than waiting for the headline metric to turn, name the leading indicators that show the system adapting: review wait time stabilizing, rework rate falling back, the share of AI-labeled changes that merge without a second round rising. These move before lead time and throughput do, and they let you distinguish a dip that is ending from one that is deepening.
Expect divergence between teams. Not every team recovers on the same schedule, and some do not recover at all. The usual reason is not the tool. It is the foundation underneath it: thin test coverage, large batch sizes, slow pipelines, or unclear specifications turn extra output into extra risk. When one team compounds gains and another stalls, the difference is diagnostic. The measurement system should be able to tell you which foundations separate the two, because that is where the next investment belongs.
Most Teams Get This Wrong: They apply a single fixed judgment date to every team. A program measured at the same moment across teams at different stages of the curve will show a blend of dips and recoveries that describes nothing real.
The Evidence Ladder: How Strongly Can You Claim It?
Everything so far produces data of different strengths, and the last discipline is honesty about which is which. Most credibility problems in AI reporting are not caused by wrong numbers. They are caused by right numbers described at the wrong strength. A usage statistic gets phrased as a productivity result. A survey gets phrased as a measurement. A model gets phrased as an outcome.
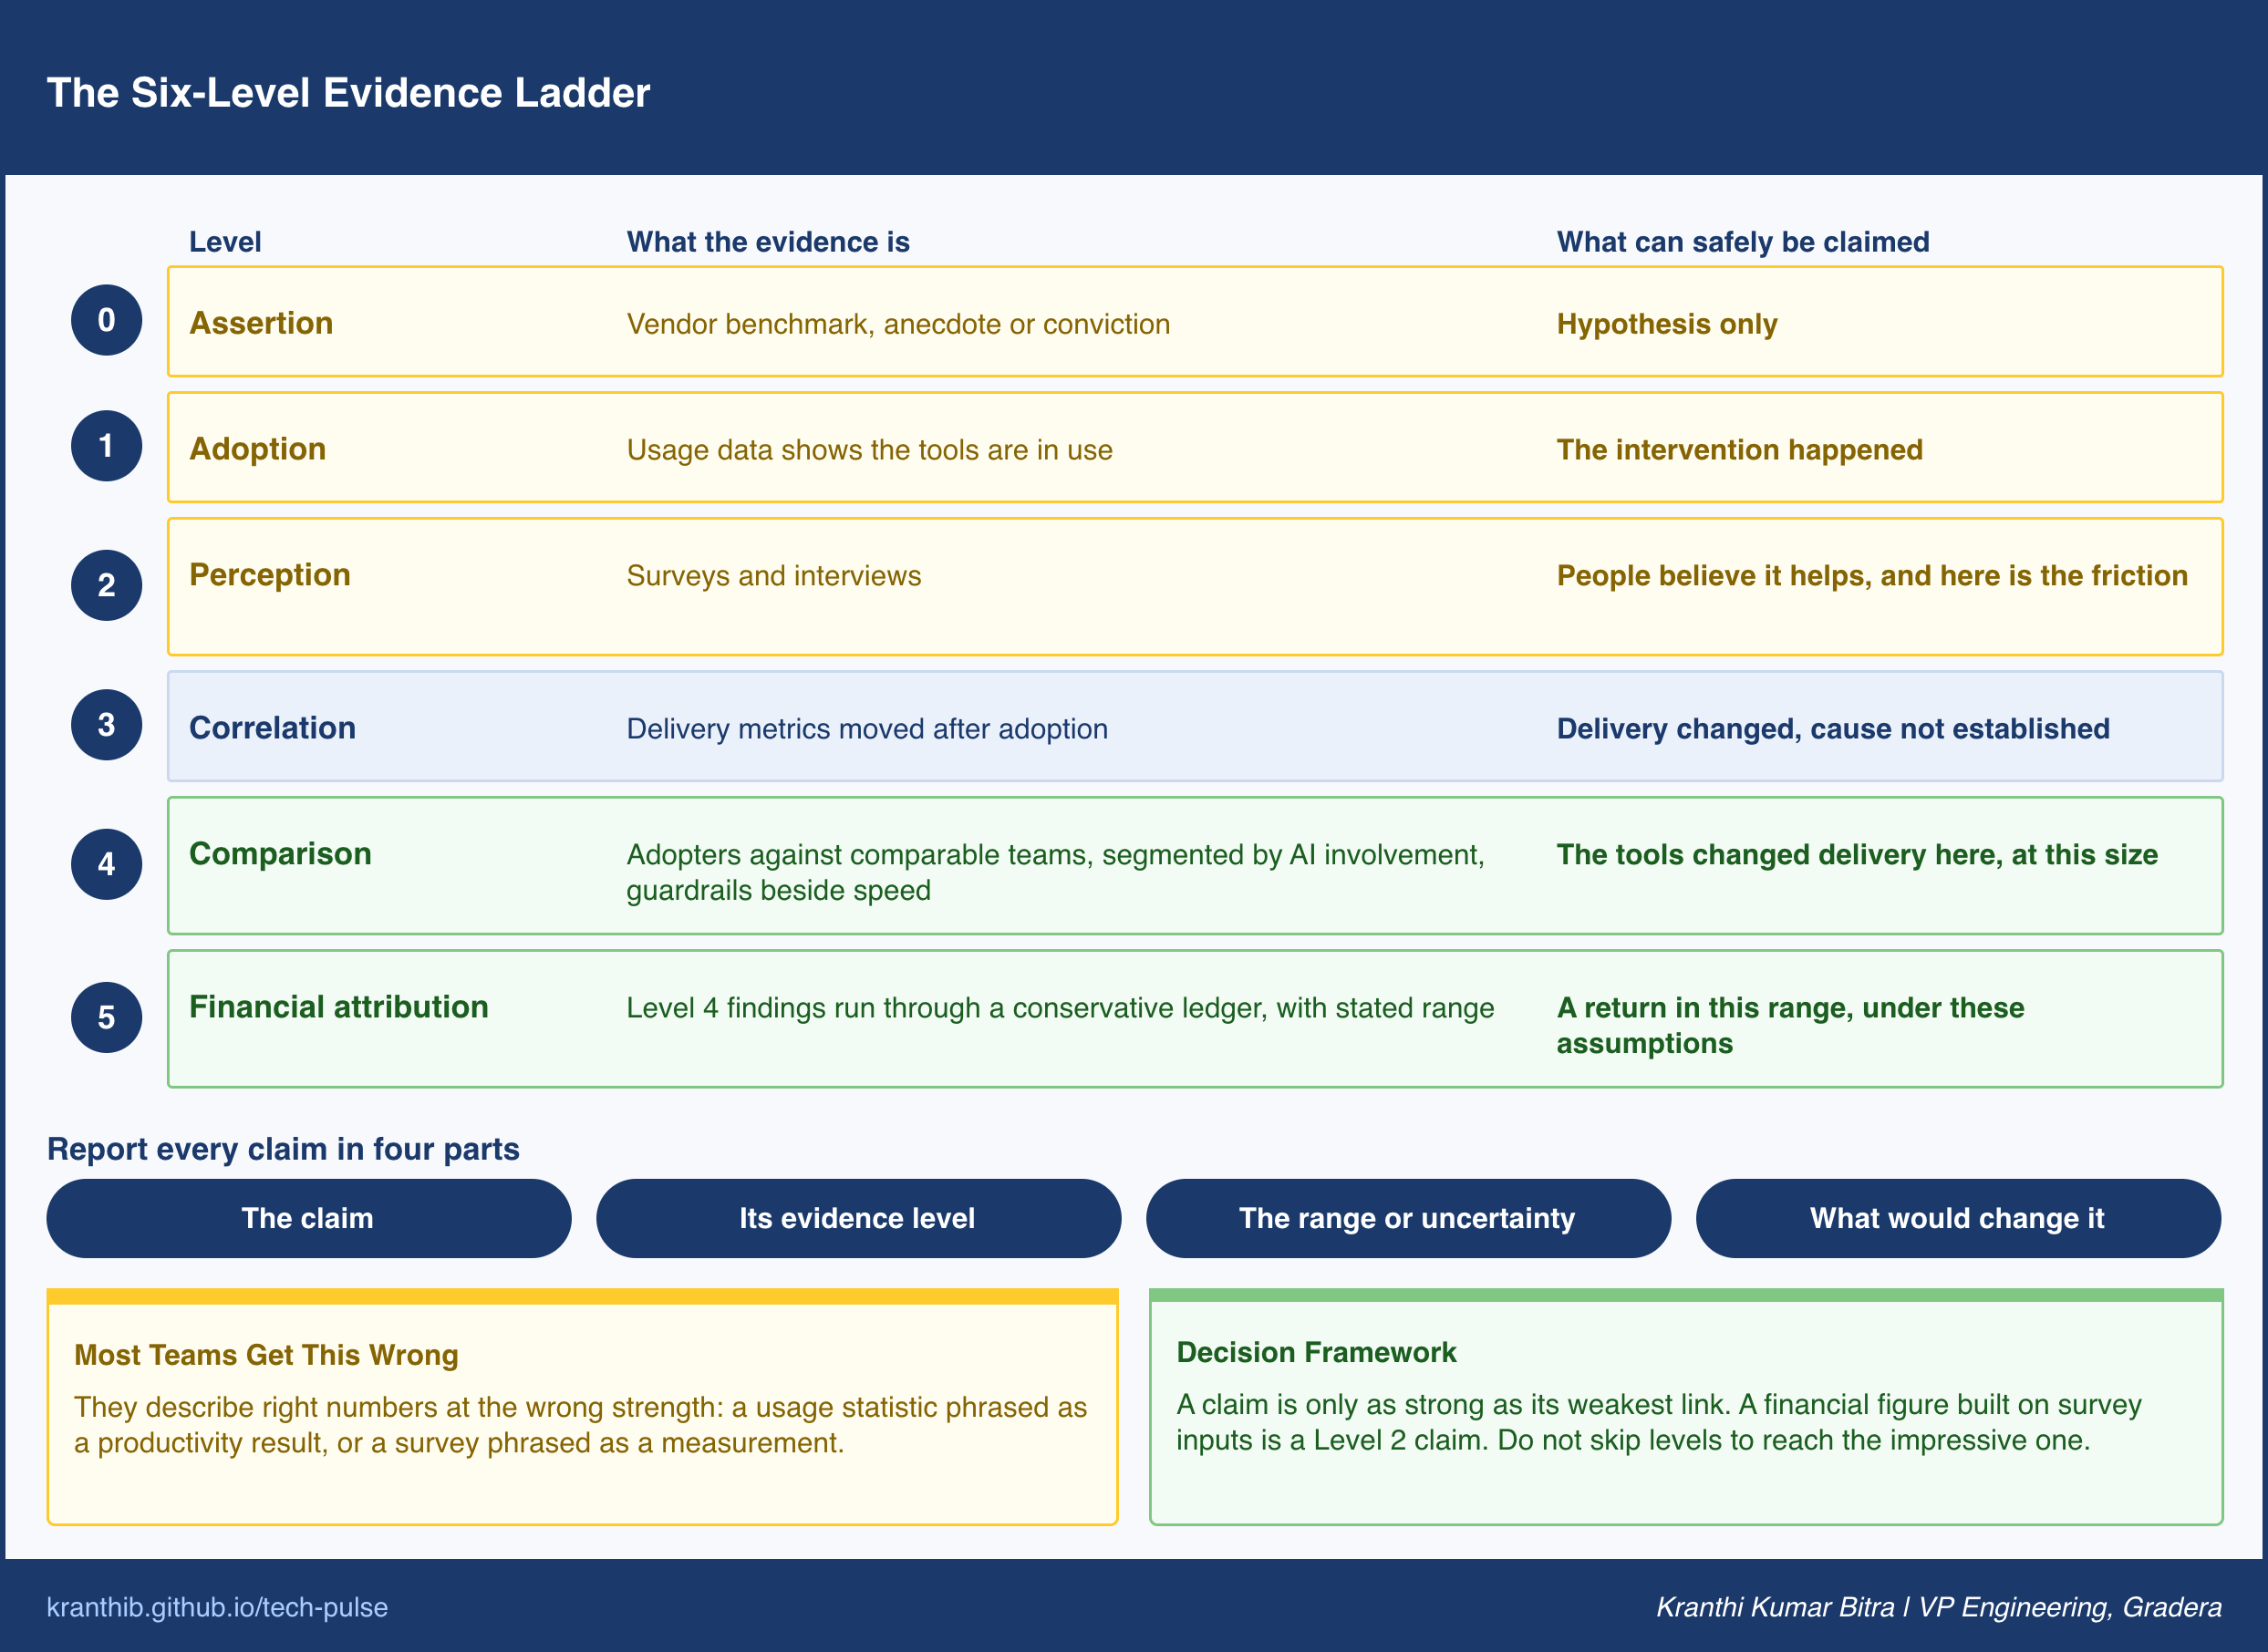
The remedy is a ladder with six levels, and a rule that every claim is reported at the level its evidence actually reaches.
Level 0, Assertion. A vendor benchmark, an anecdote, or a leader’s conviction. Useful as a hypothesis. Never a result.
Level 1, Adoption. Usage data shows the tools are in use, by how many, and how often. It establishes that the intervention happened.
Level 2, Perception. Surveys and interviews show that people believe the tools help, and where they find friction. It explains experience and points to diagnosis.
Level 3, Correlation. Delivery metrics moved after adoption. This is the before-and-after result: real, and confounded by everything else that changed in the same period.
Level 4, Comparison. Teams with the tools differ from comparable teams without them over the same period, segmented by recorded AI involvement, with quality guardrails reported alongside speed. This is the first level at which the claim can survive a skeptical reader.
Level 5, Financial attribution. The Level 4 findings are converted through a conservative cost and value ledger into money, with the assumptions and a range stated openly.
Two rules keep the ladder honest. First, a claim is only as strong as its weakest link. A Level 5 dollar figure built on Level 2 inputs is a Level 2 claim wearing a suit. Second, do not skip levels to reach the impressive one. The financial number is the last to be earned, not the first to be asked for.
For reporting, a four-part format works well and is easy to standardize: the claim, the evidence level it rests on, the range or uncertainty, and what result would change the conclusion. That final element is the one finance partners find most credible, because it demonstrates that the claim can be wrong and that someone has thought about how.
A Worked Example: The First Honest Readout
Consider an engineering organization with twelve product teams that decides to build the measurement system before the broad rollout. The scenario here is a composite, simplified to show the mechanics.
The organization defines its metrics up front: throughput of completed work items, lead time for changes, time to first review, rework rate within a fixed window, change failure rate, and a quarterly experience survey. It adds a three-level involvement label to every pull request. It divides the teams into three waves of four, assigns the waves by a mix of team size and codebase maturity rather than by volunteering, records two full release cycles of baseline, and begins a confounder log.
At the first readout, the wave-one teams have used the tools for a full cycle while wave three has not yet started. The picture is mixed, which is what real data usually looks like.
Adoption in wave one is nearly universal, a Level 1 fact. The survey is strongly positive, a Level 2 fact. Coding time has fallen sharply, and in a simple before-and-after view, overall cycle time appears to have improved, a Level 3 observation that the team correctly declines to headline.
The comparison against wave three tells a more careful story, Level 4. Two of the four wave-one teams show higher throughput with stable rework and no rise in failures. One shows higher throughput alongside rising rework. One shows no change. In all four, time to first review has lengthened. Segmenting by involvement label sharpens it further: agent-authored changes in well-tested services have low rework, while the same kind of change in a legacy service with thin test coverage shows high rework.
The ledger adds the last layer. The drafting time reclaimed is real, but a substantial part of it is absorbed by longer reviews and by correcting changes that came back for rework. The verification tax, made visible for the first time, accounts for much of the difference between the survey’s enthusiasm and the delivery data’s modest gain.
The report the organization sends to finance is smaller than the one first sketched, and it survives review. It states the throughput improvement in two teams at Level 4 with the guardrail data beside it. It states the other findings at Level 3. It offers no Level 5 figure yet and says why: one more cycle of comparison data is needed, and the range will be stated then. The decisions that follow are specific. Expand to wave two with review triage in place. Invest in test foundations in the legacy service before extending agent-authored work there. Schedule the next readout.
The important outcome is not the size of the number. It is that the organization now knows where the tools help, where they cost more than they return, and what to fix, and that the finance partner trusts the next report because the first one did not overreach.
What Most Teams Get Wrong
Waiting for the perfect metric. Measurement programs stall while teams debate the ideal productivity definition. There is no perfect one. Start with the paired stack, fix the definitions, and refine them in the open, because a mediocre measurement with a baseline beats a perfect measurement that starts after the tools are everywhere.
Treating measurement as a one-time study. Tools change generation quickly, and the answer to last quarter’s question may not describe this quarter’s tools. The value of measurement is longitudinal. Keep the baseline, keep the labels, and re-measure when the tooling changes meaningfully, or the organization will be making current decisions from old evidence.
Reporting a single blended number. An average across all teams and all kinds of work hides the very divergence the program exists to find. A leader who sees only the blended figure cannot tell whether to scale, hold, or fix, because the answer differs by team and by task type. Report the distribution.
Using the data to evaluate individuals. The moment measurement is read as a performance review, labels get avoided and metrics get gamed. The data belongs to the system. Keep it aggregated at team level and be explicit about that, in writing, before the first dashboard goes live.
Reading a flat or negative result as a failure of measurement. A finding that the tools are not helping in a particular codebase is exactly what the system is for. It is the cheapest possible way to learn where the next investment should go, and it is far better delivered by a comparison than by a quarter of quiet disappointment.
The First 90 Days
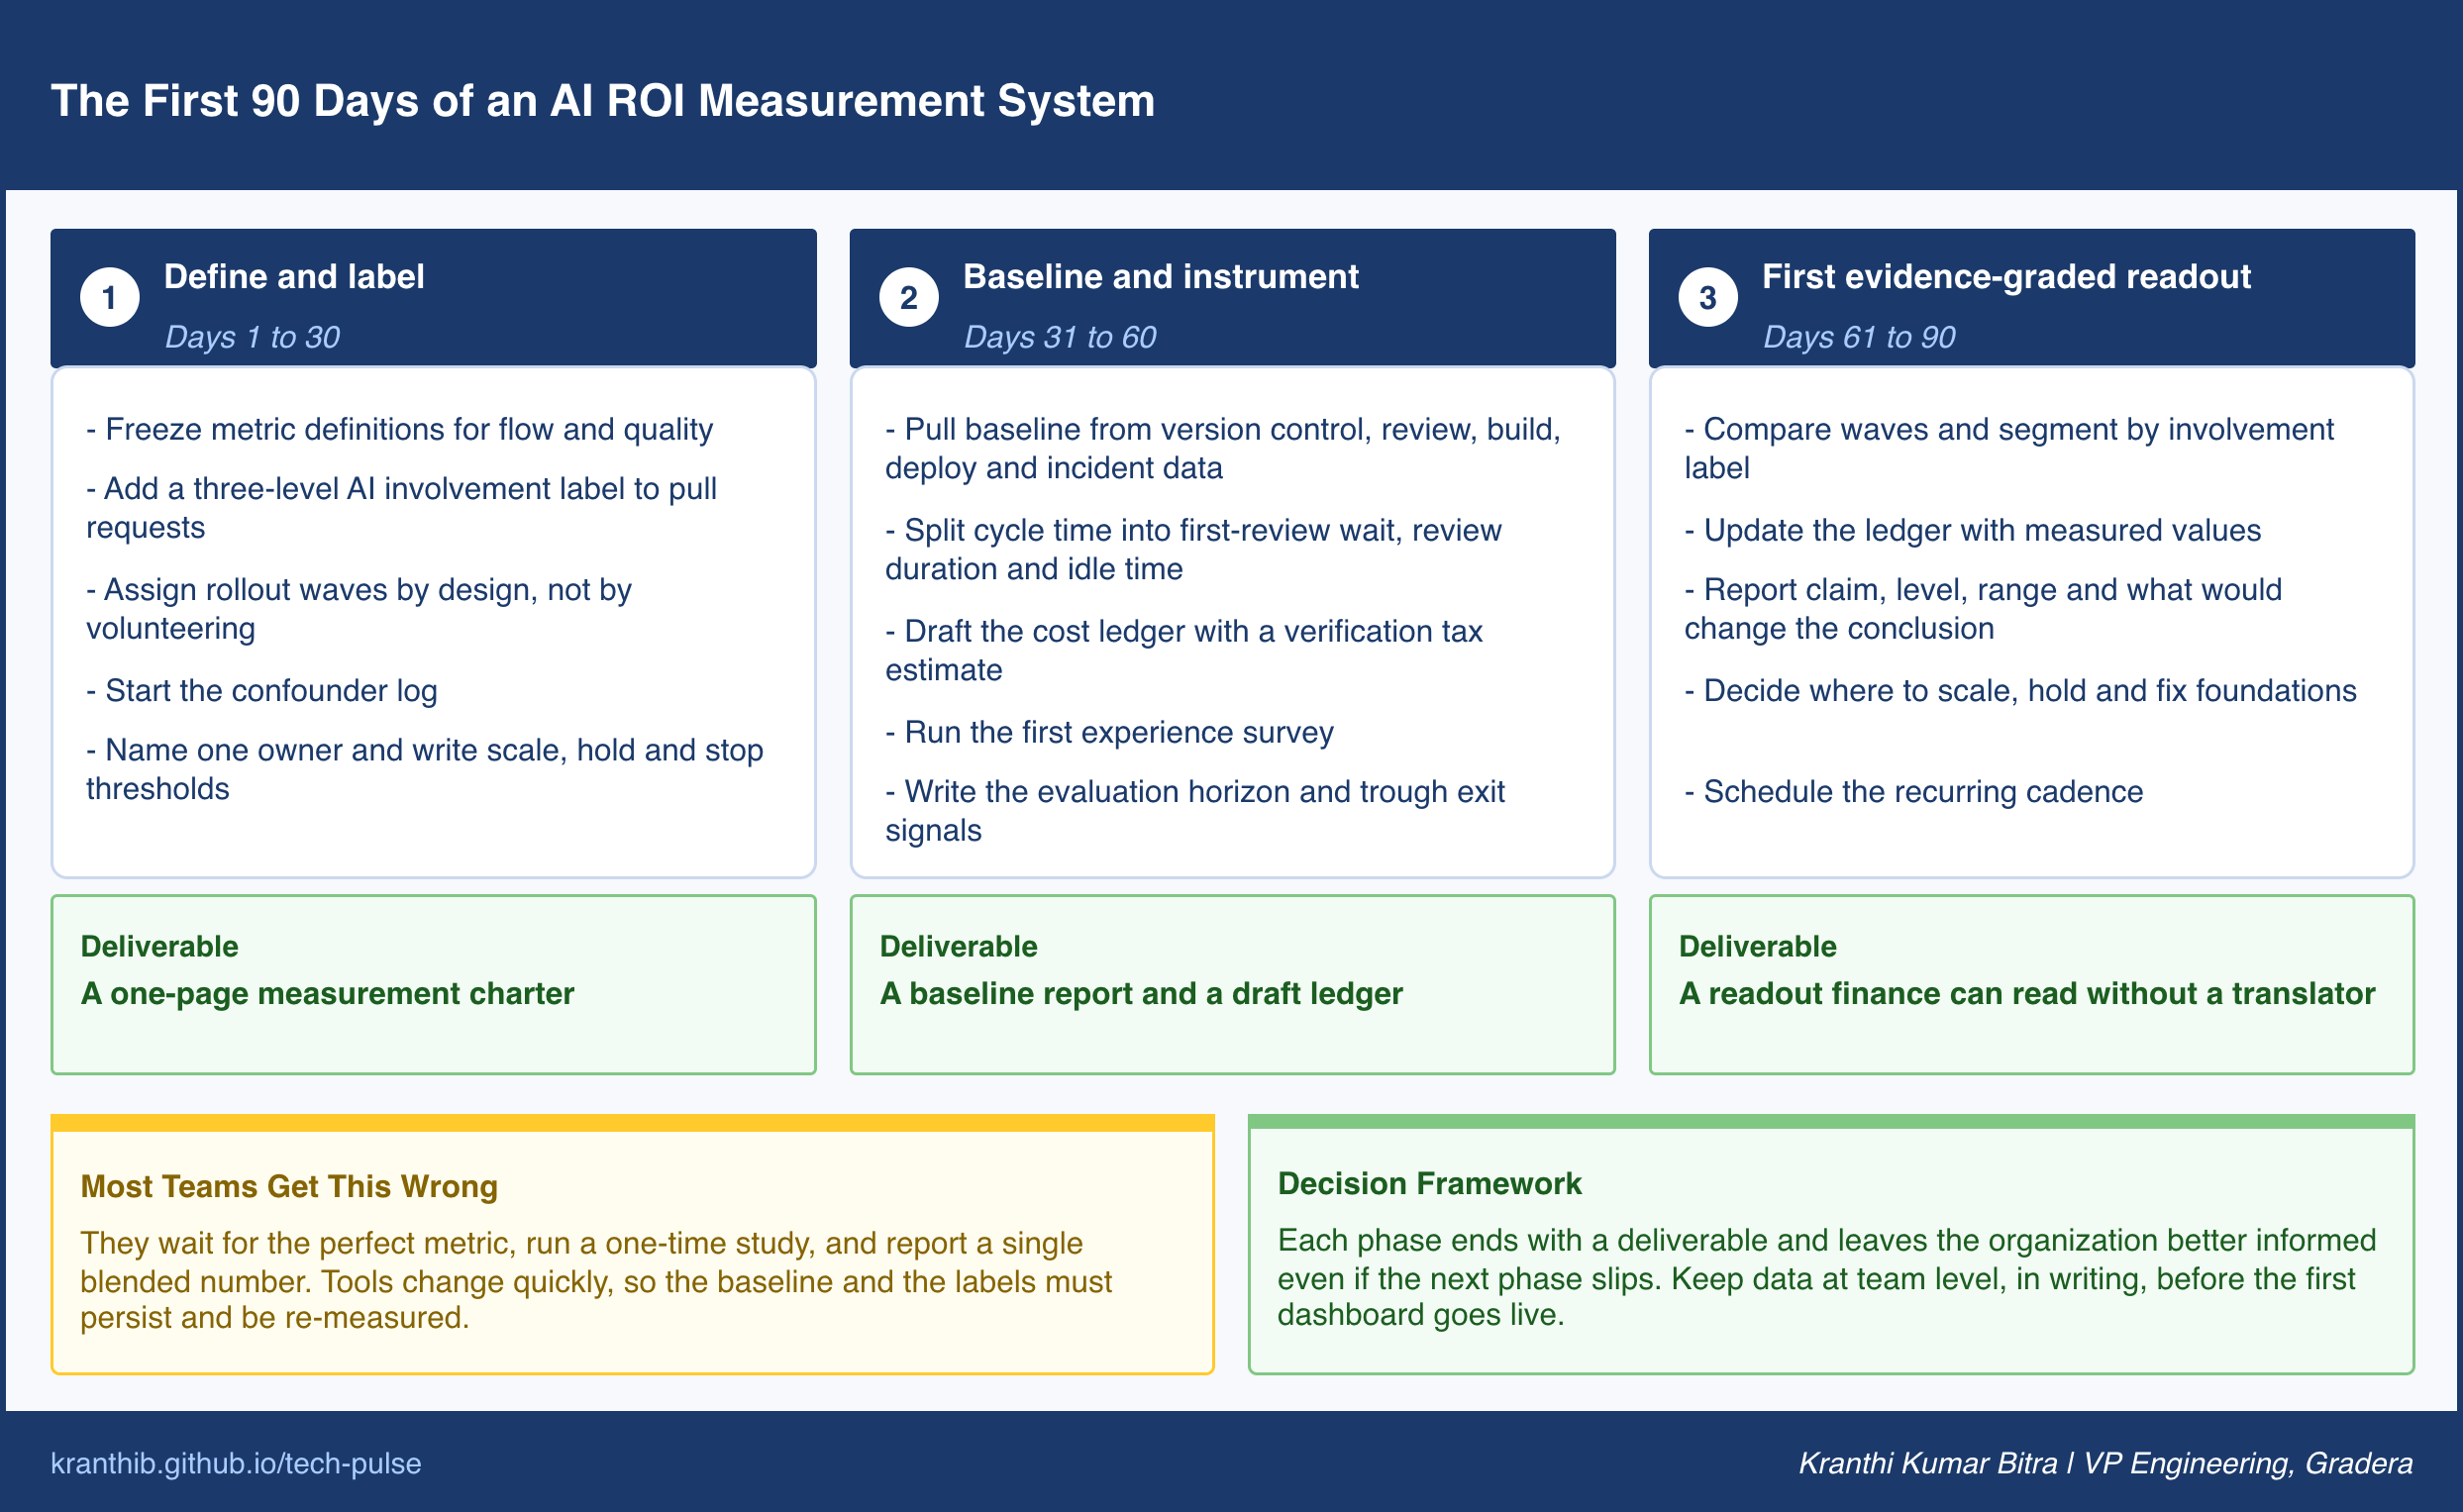
The framework above can be stood up in a single quarter without new platforms, as long as the sequence is respected. The three phases each end with a concrete deliverable, and each one leaves the organization better informed even if the next phase slips.
Phase one: define and label. Freeze the metric definitions for the flow and quality layers. Put the three-level AI involvement label into the pull request workflow. Assign rollout waves by design instead of by volunteering. Start the confounder log. Name one owner for the program and write down the thresholds that would cause the organization to scale, hold, or stop. The deliverable is a one-page measurement charter.
Phase two: baseline and instrument. Pull the baseline for flow and quality from version control, review, build, deploy, and incident systems. Split pull request cycle time into first-review wait, review duration, and idle time. Draft the cost ledger, including an honest estimate of the verification tax. Run the first experience survey. Write down the evaluation horizon and the exit signals from the trough. The deliverable is a baseline report and a draft ledger.
Phase three: the first evidence-graded readout. Compare waves. Segment by involvement label. Update the ledger with what was measured. Produce the four-part report: claim, evidence level, range, and what would change the conclusion. Make one decision each on where to scale, where to hold, and where to fix foundations. The deliverable is a readout that a finance partner can read without a translator.
Where This Is Heading
Measurement is likely to migrate from a special project into a default property of the engineering platform. Involvement labels will be recorded automatically where changes are authored, cost attribution will be tagged at the workflow level, and the baseline will be a standing asset instead of an artifact of a one-off study. Organizations that treat this as infrastructure now will have long histories to compare against when the next generation of tools arrives.
Finance expectations will also mature. Cloud spending went through the same progression, from a lump-sum bill nobody could allocate to unit economics tracked by team and workflow. AI spending in engineering will follow, and the questions will move from how much was spent to what each completed, unreworked unit of delivery cost. The teams that already carry a ledger and labeled changes will answer that in an afternoon.
As agents author a growing share of changes, attribution becomes central instead of optional. Whether a change was drafted by a person, assisted, or authored by an agent will matter for cost, for quality analysis, for incident review, and for governance. The organizations that built the labeling habit early will find that the measurement system doubles as the audit trail.
The direction of travel favors those who are honest about evidence. Reporting at the true level of the data will look conservative at first and will become a competitive advantage, because it is the only kind of reporting that keeps working after the second renewal conversation.
The Decision to Make This Week
Before the next budget or renewal discussion, write down the one sentence you would say to your finance partner about what AI has returned. Then label it with its level on the ladder.
If it sits at Level 3 or below, you have found your measurement plan. Pick the first wave, freeze the definitions, and add the involvement label to the pull request workflow. Everything else in this post is how you climb the remaining levels, one honest claim at a time.