
AI Observability and LLM Monitoring in Production: The Discipline Your Team Is Missing
“A production AI system can be fully operational — correct latency, zero errors, 100% uptime — and producing wrong answers for every user. Traditional monitoring will not catch it.”
TL;DR
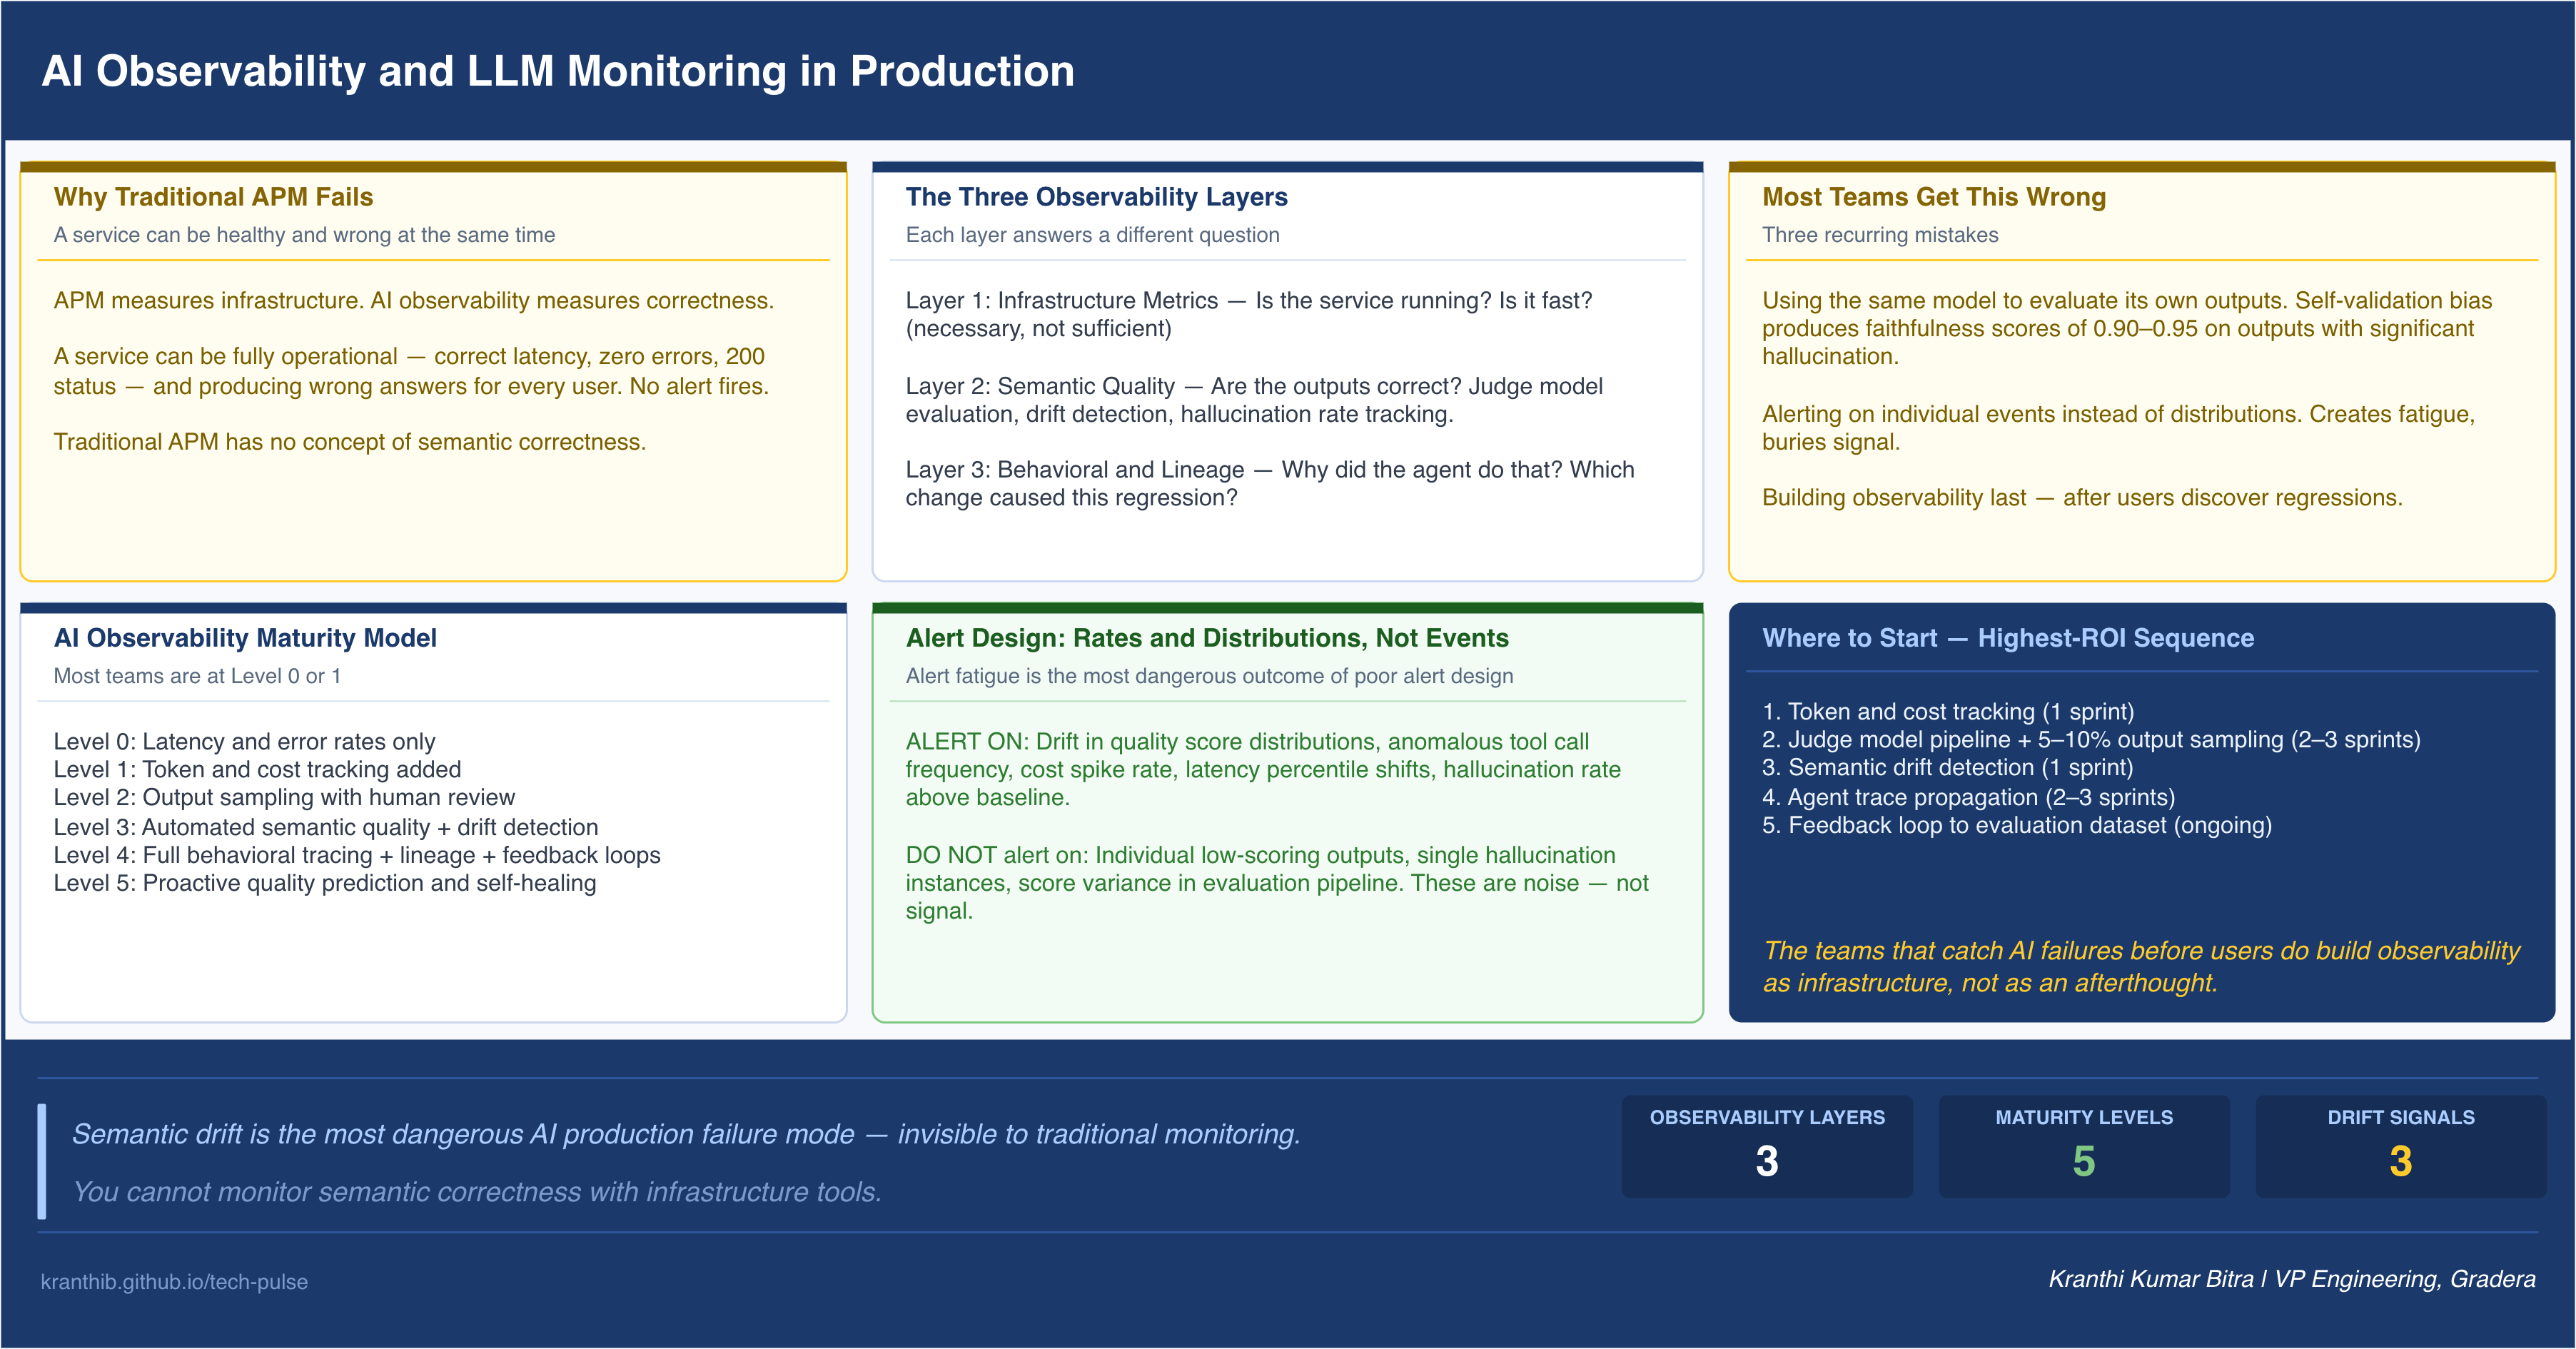
Traditional APM tools measure whether your system is running. AI observability measures whether your system is correct. These are fundamentally different problems requiring fundamentally different instrumentation. This post introduces a three-layer AI observability framework covering semantic quality monitoring, behavioral monitoring, and lineage monitoring; a five-level maturity model for assessing your current posture; alert design principles specific to AI failure modes; sampling strategies for human review at scale; and a feedback loop architecture that turns production signal into training improvement. By the end, you will have a complete blueprint for building AI observability as infrastructure rather than as an afterthought.
Who This Is For
This post is for engineering leaders and senior engineers who are running AI-powered systems in production and who want a rigorous framework for knowing when those systems fail. Specifically:
- Engineering managers whose teams have deployed LLMs or agentic systems and are measuring primarily latency and error rates
- Platform engineers designing the observability layer for AI services
- Tech leads responsible for SLA commitments on AI-powered features
- Anyone who has woken up to a user complaint and realized their monitoring caught nothing
If you are still in evaluation or staging, this framework is worth internalizing before deployment. The failure modes described here do not surface during development. They appear in production, gradually, and by the time they are visible in user feedback, they have been present for days or weeks.
The Incident That Made This Real for Me
Eighteen months ago, a customer support AI at a fintech company passed every test, every staging review, and every quality gate the team had built. It went live on a Friday. By the following Wednesday, customer satisfaction scores had dropped 12 points. The support team was flooded with escalations. The AI system was, from an infrastructure perspective, perfectly healthy: p95 latency at 340ms, error rate at 0.02%, uptime at 99.97%.
The AI had drifted. Its retrieval context had shifted after a knowledge base update two weeks earlier. Its responses had become subtly but consistently wrong about refund eligibility. Every answer was confident, well-formatted, and plausible. No exception was thrown. No alert fired.
The team discovered the problem through a customer complaint, not through monitoring. They had been measuring the wrong things.
This is not an unusual story. It is a predictable consequence of applying traditional observability thinking to a fundamentally different failure mode. Traditional systems fail loudly: exceptions, timeouts, 5xx responses. AI systems fail quietly: responses that are syntactically correct but semantically wrong. The instrumentation discipline must match the failure mode.
Why Traditional APM Fails for AI Systems
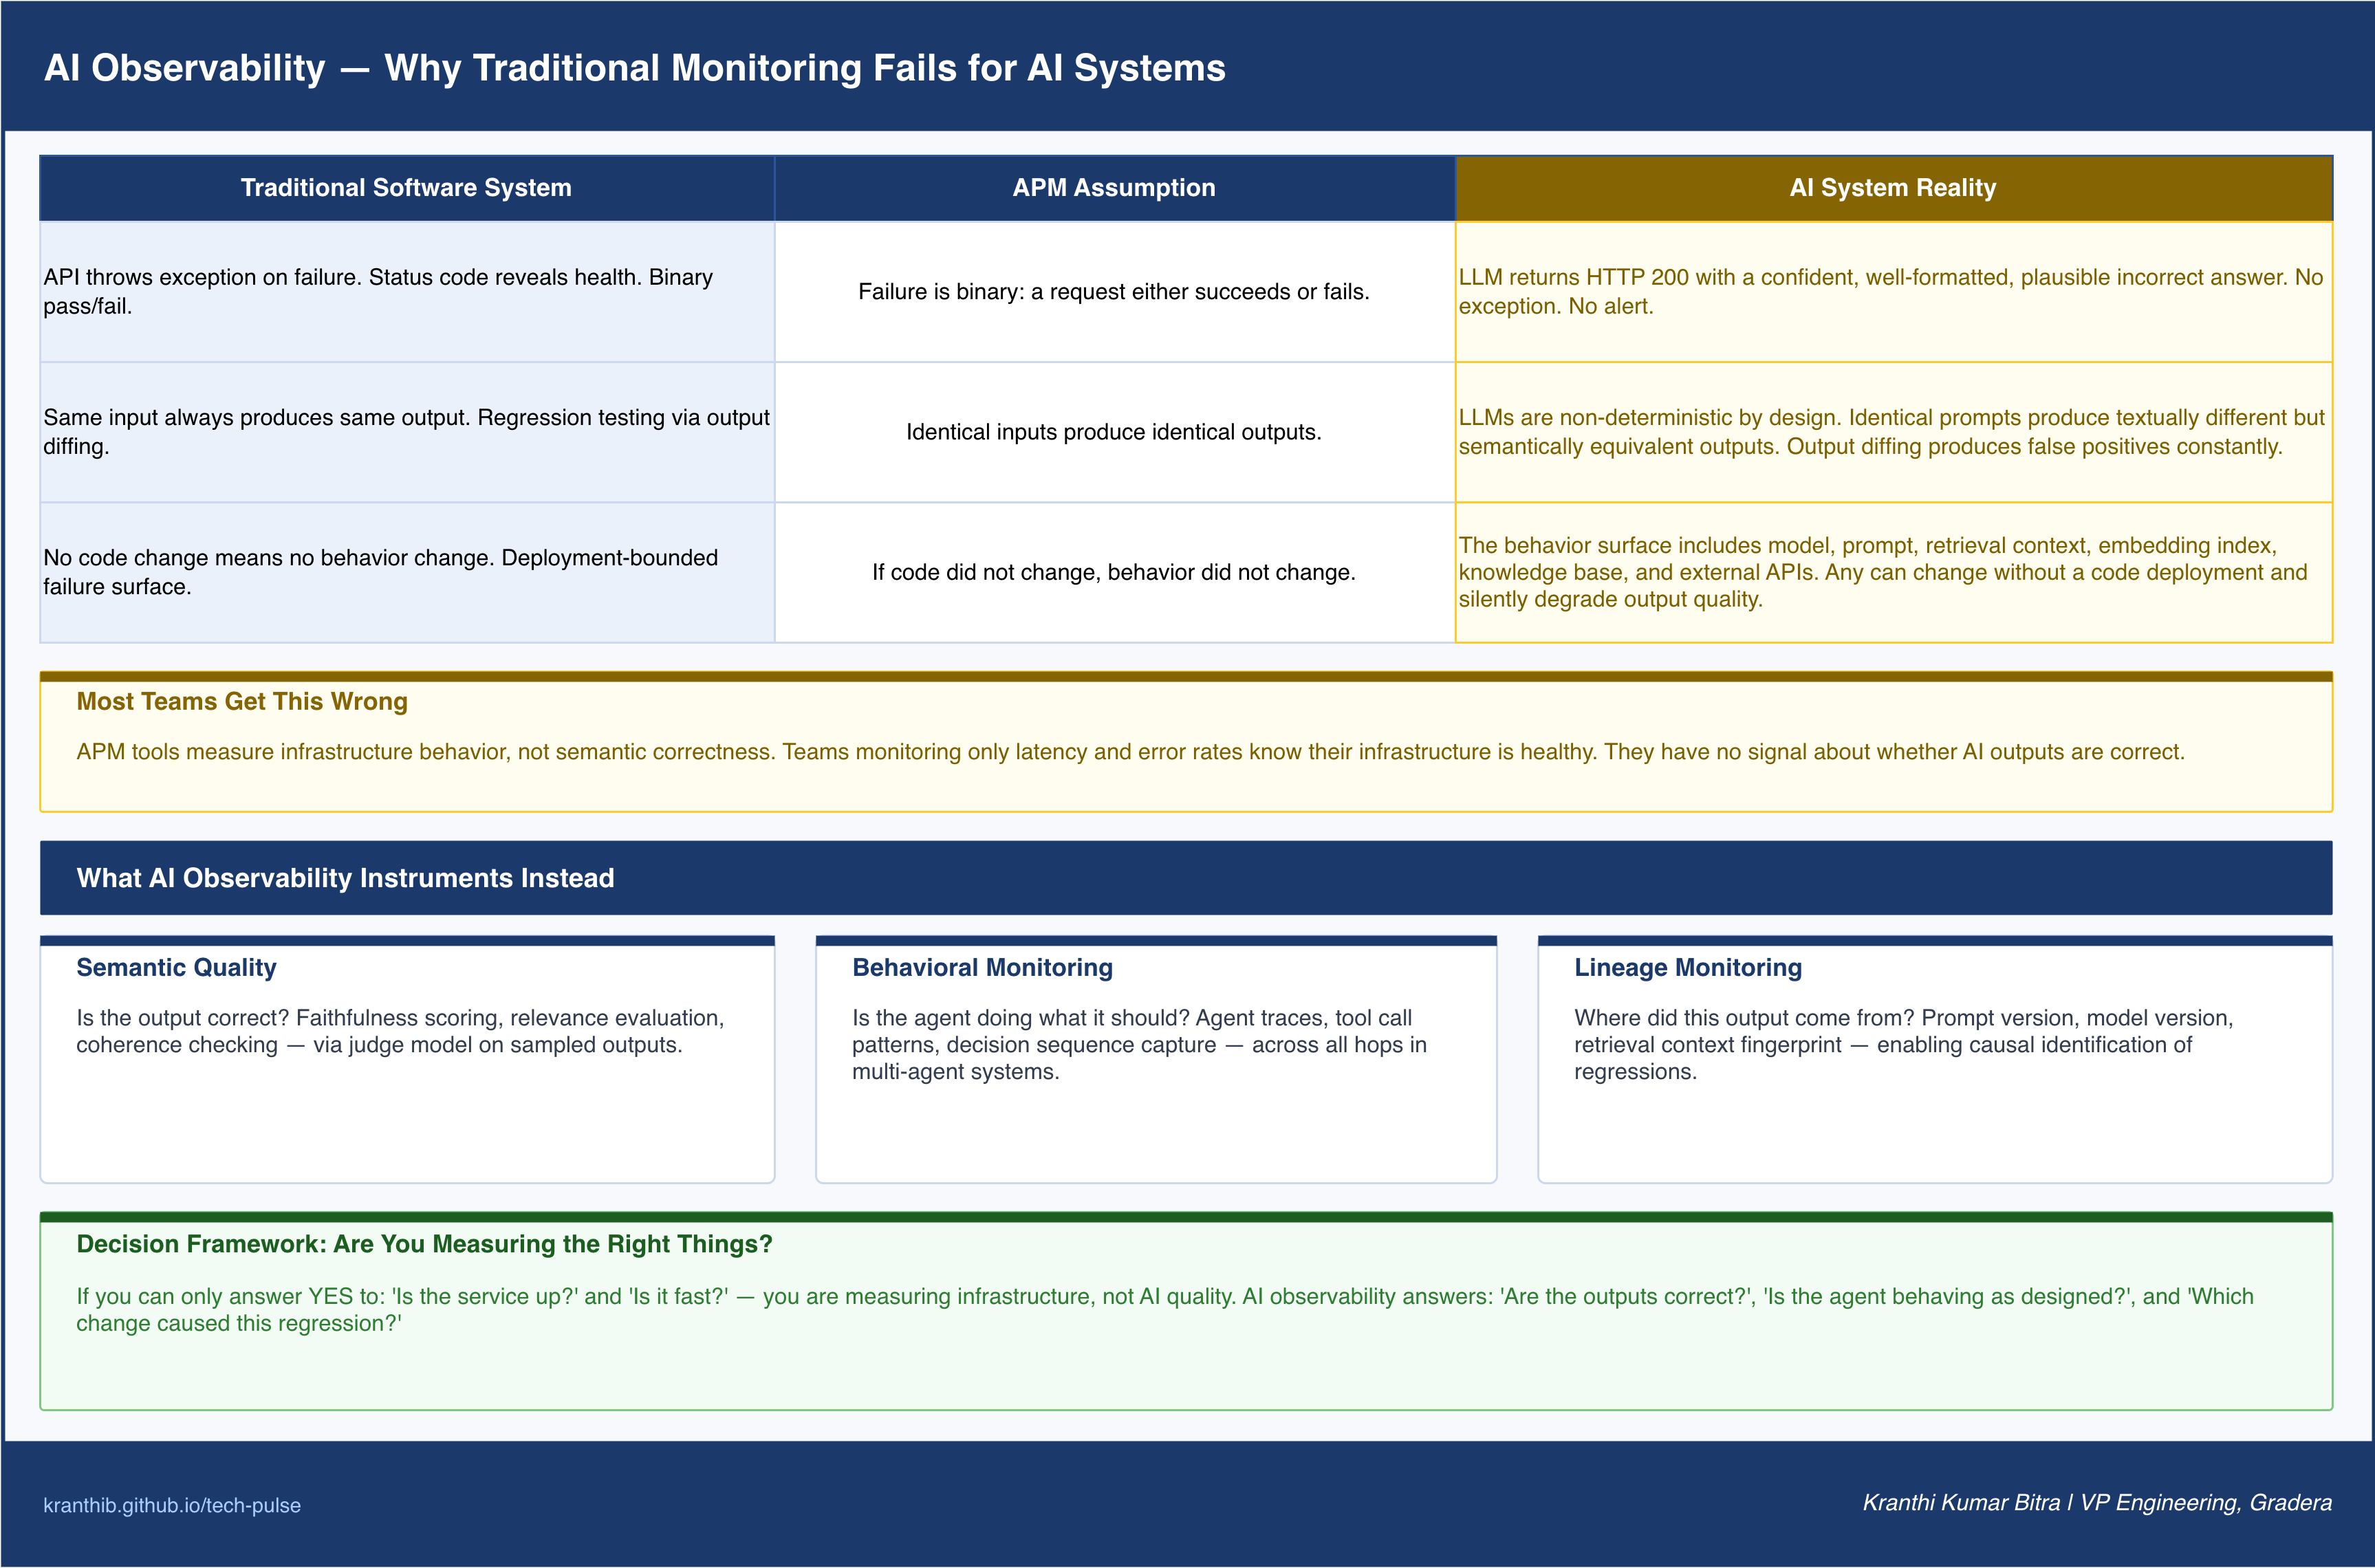
Traditional application performance monitoring was designed around three assumptions that do not hold for AI systems.
Assumption 1: Failure is binary. In a conventional service, a request either succeeds or fails. There is a return code, an exception class, a status field. The monitoring system polls these signals. In an LLM-powered service, failure is not binary. A response can be structurally valid, latency-within-SLA, HTTP 200 — and semantically wrong. The concept of correctness is not captured in any field the APM tool can read.
Assumption 2: Identical inputs produce identical outputs. The determinism assumption underpins the value of replay testing, regression suites, and canary comparisons in traditional monitoring. Run the same request before and after a deployment; if the response differs, something changed. LLMs are non-deterministic by design. Two identical requests to the same model with the same parameters will produce outputs that are semantically equivalent but textually different. Byte-level comparison of outputs breaks immediately; there is no canonical “correct” output to compare against.
Assumption 3: The failure surface is bounded by the code. In a traditional service, if the code did not change, the behavior did not change. In an AI-powered service, the behavior surface includes the model, the prompt, the retrieval context, the embedding index, the knowledge base, and the external APIs the agent calls. Any of these can change without a code deployment — and each change can produce output drift that is invisible to infrastructure monitoring.
These three gaps are not shortcomings of any particular APM tool. They are structural. No amount of configuration changes the fact that APM tools measure infrastructure behavior, not semantic correctness.
The practical consequence: teams running AI systems with traditional APM coverage only know that their infrastructure is healthy. They have no signal about whether their AI outputs are correct, coherent, or improving over time. This is not observability. It is uptime monitoring.
The Three Observability Layers
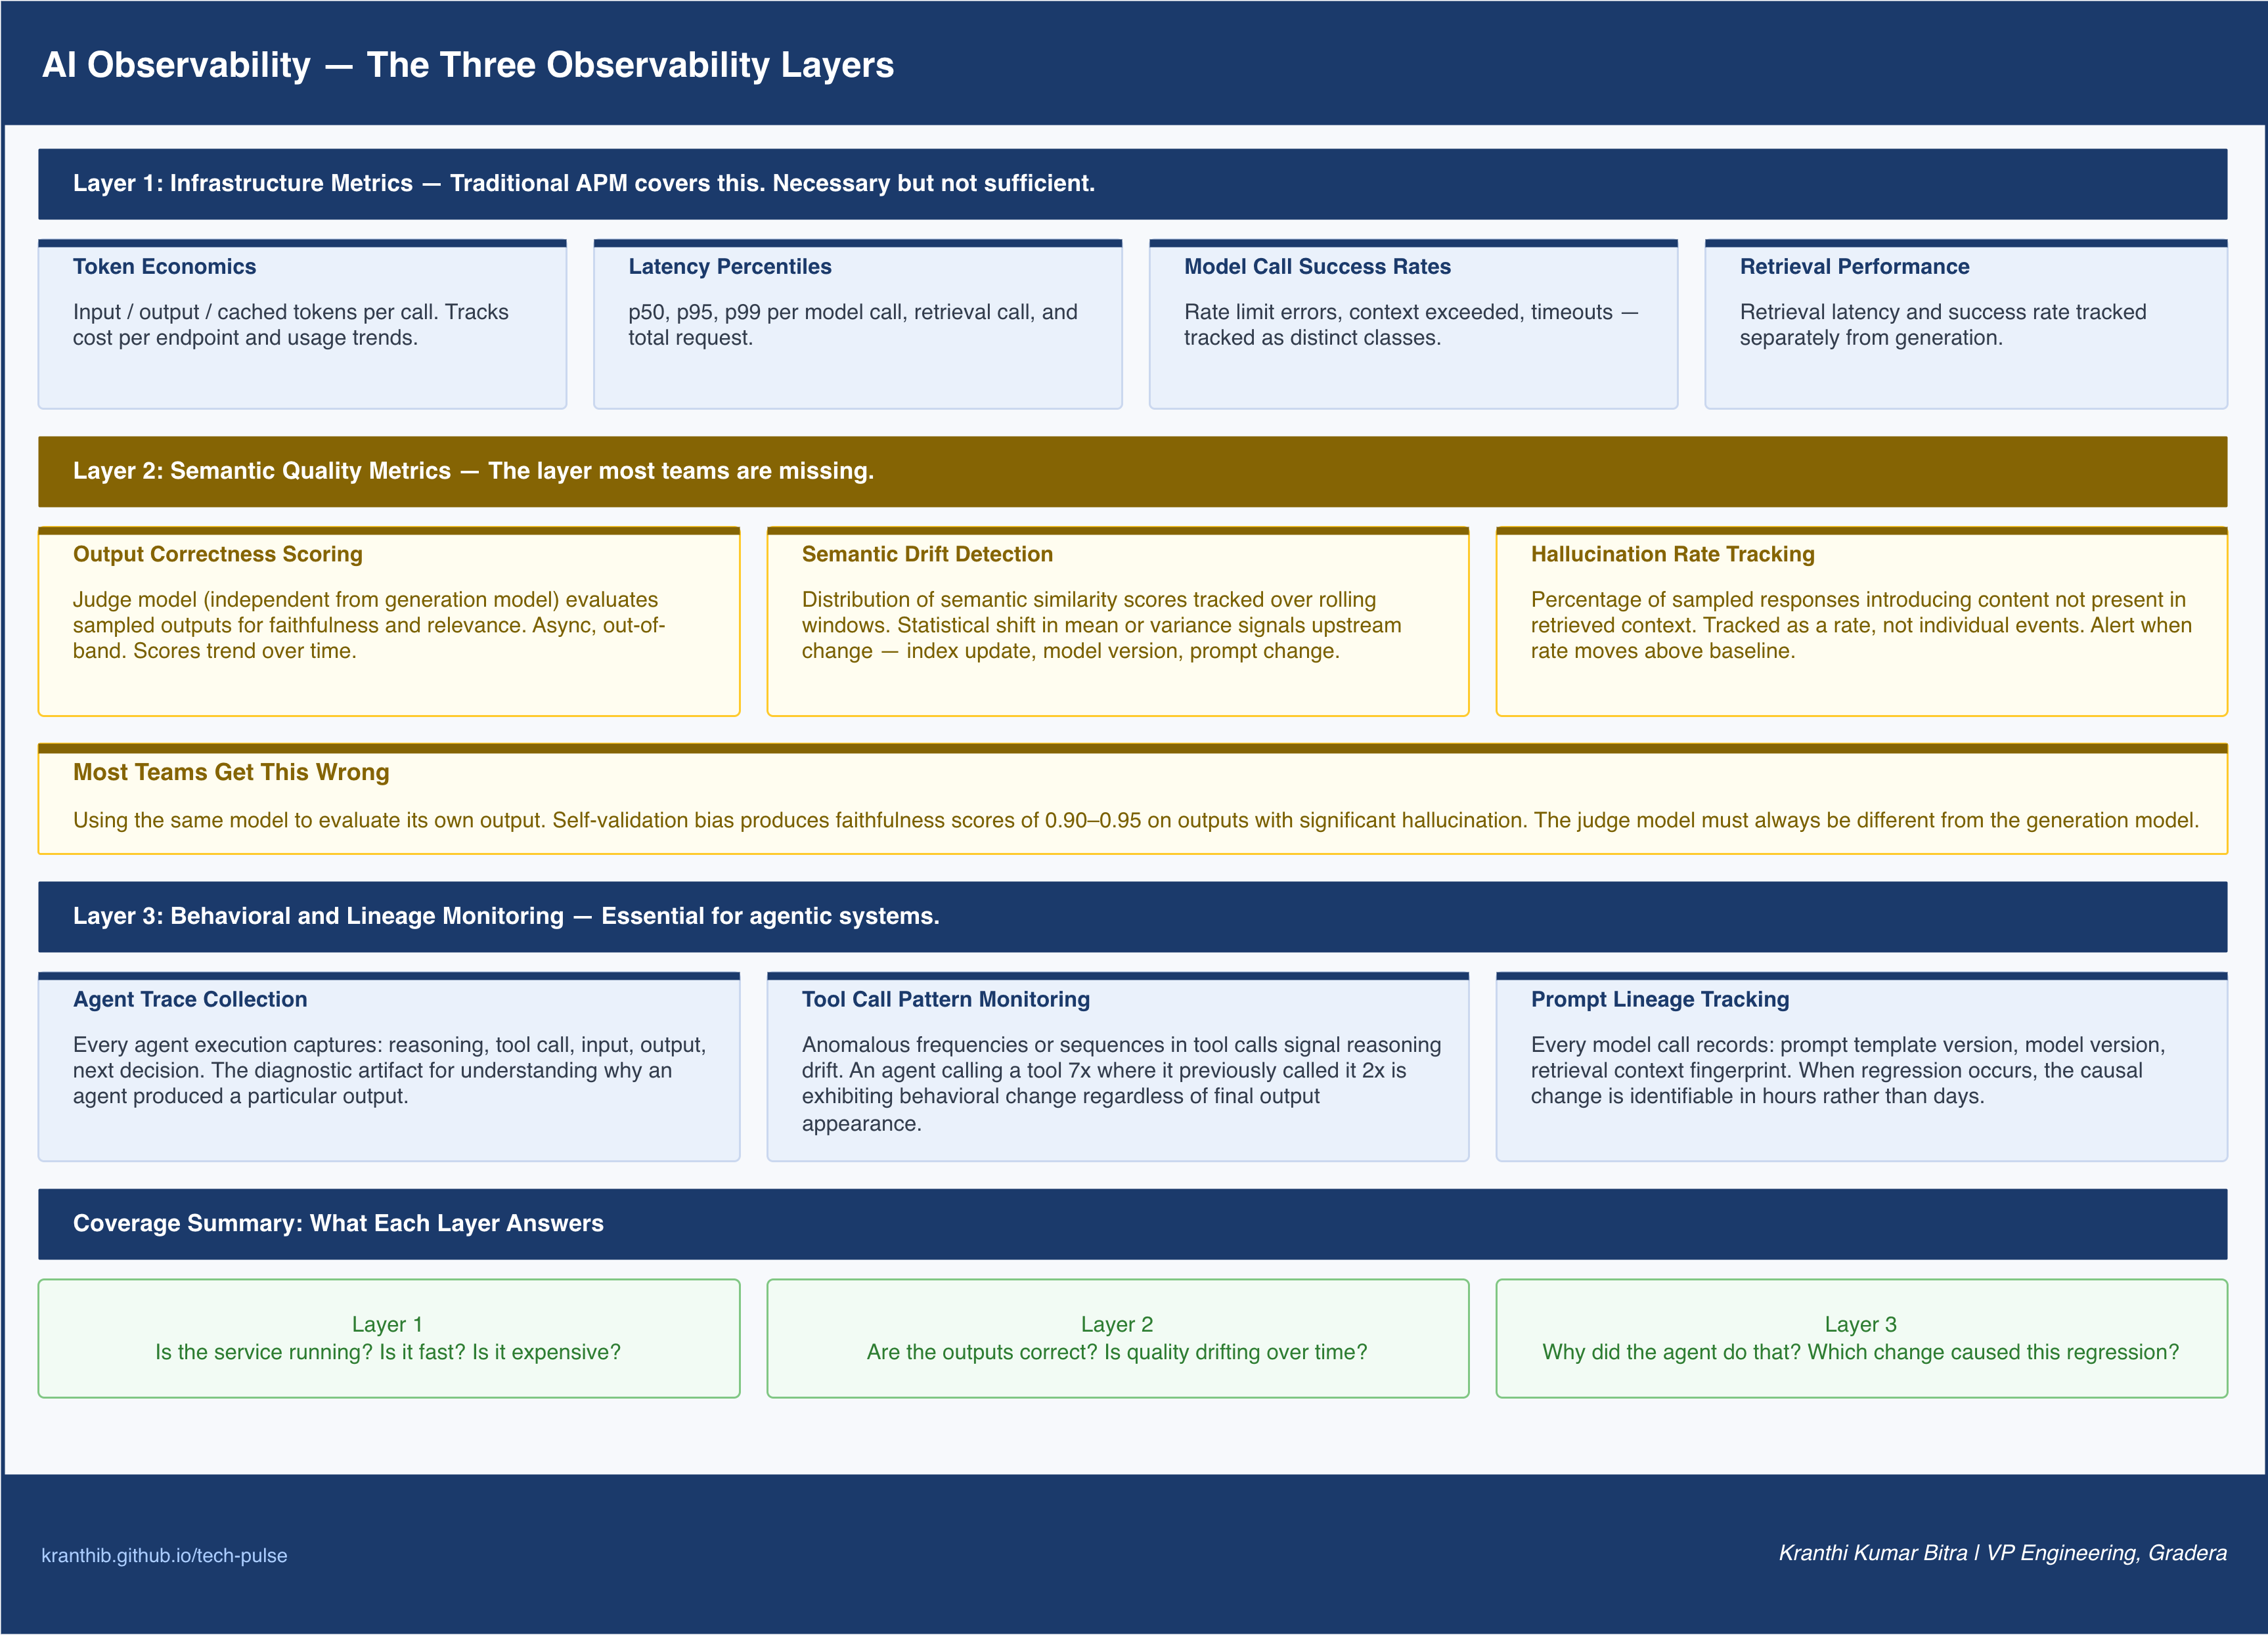
AI observability requires three distinct layers of instrumentation. Each layer measures a different dimension of system behavior, uses different techniques, and requires different tooling. Teams that implement only one or two layers have observability gaps that will eventually surface as user-facing failures.
Layer 1: Infrastructure Metrics
This is the layer traditional APM covers, and it remains necessary. The question is not whether to instrument it, but whether to mistake it for sufficient coverage.
Infrastructure metrics for AI systems include:
Token economics. Every LLM call consumes tokens with a cost and a latency profile. Token count tracking should capture input tokens, output tokens, and cached tokens separately. Input token spikes often indicate prompt bloat; output token spikes often indicate runaway generation. Token count histograms by endpoint and by day reveal cost trends before they appear on the billing cycle.
Latency percentiles. p50, p95, and p99 latency by model call, retrieval call, and total request. In agentic systems where multiple model calls occur per user request, total request latency can mask high variance in individual steps. A 2-second total request with a p99 model call of 1.8 seconds is structurally fragile; the first time that call spikes, the request breaks its SLA.
Model call success rates. Rate limit errors, context length exceeded errors, and timeout errors are distinct failure classes that require different mitigations. Instrumenting them as a single “error rate” obscures which failure is occurring and why.
Retrieval performance. For RAG-based systems, retrieval latency and retrieval success rate should be tracked separately from generation latency. A retrieval tier that returns in 40ms versus 800ms has significant downstream consequences for user experience and model performance.
These metrics are necessary but not sufficient. They tell you the infrastructure is working. They say nothing about whether the AI is producing correct output.
Layer 2: Semantic Quality Metrics
This is the layer most teams are missing. Semantic quality monitoring asks whether the AI output is correct, relevant, and coherent — and it requires instrumentation that operates at the meaning level, not the infrastructure level.
Output correctness scoring. A dedicated judge model evaluates sampled outputs against the original query and retrieved context. The judge asks: is this answer faithful to the context provided? Is it relevant to the question asked? Does it introduce claims not supported by the context? Faithfulness and answer relevance scores, calculated by a judge model different from the generation model, provide a continuous signal about output quality over time.
Semantic drift detection. The distribution of semantic similarity between queries and responses should be stable over time on a well-functioning system. When that distribution shifts — the mean drops, the variance increases, the tail thickens — it is a signal that something in the underlying system has changed: a retrieval index update, a model version change, a prompt modification, or a data distribution shift in incoming queries. Tracking the cosine similarity distribution across sampled responses over a rolling window provides early warning of drift before it surfaces in user feedback.
Hallucination rate tracking. Using a judge model to score the percentage of sampled responses that introduce information not present in the retrieved context. Even at low base rates, hallucination is a metric that should be tracked, trended, and alerted on. A system that hallucinates in 1% of responses will produce a wrong answer for 1,000 users in every 100,000 interactions.
Response coherence. For conversational systems, tracking whether multi-turn responses maintain logical consistency across a session. A response that contradicts a fact stated two turns earlier is a coherence failure invisible to infrastructure monitoring.
The implementation principle for semantic quality monitoring: sample a fraction of production responses, route them through an async evaluation pipeline, and write scores to a time-series store. The evaluation pipeline must not sit in the request path — latency overhead there breaks the user experience. The pipeline runs out-of-band, with results available within minutes to hours depending on the sampling rate and evaluation throughput.
Layer 3: Behavioral and Lineage Monitoring
In agentic systems, the failure surface extends beyond individual outputs to include the full sequence of agent decisions: which tools were called, in what order, with what inputs, and why. Behavioral monitoring instruments this decision sequence. Lineage monitoring tracks the provenance of each output — which prompt version, which model version, which retrieval context, and which tool responses contributed to the final answer.
Agent trace collection. Every agent execution should produce a structured trace capturing each step: the reasoning that led to a tool call, the tool called, the input provided, the response received, and the next decision made. These traces are the diagnostic artifact for understanding why an agent produced a particular output. Without them, debugging agentic failures is forensic archaeology.
Tool call pattern monitoring. Anomalous tool call patterns — unexpected call frequencies, unusual sequences, calls to tools that should not be relevant for a given query type — are early signals of agent behavior drift. An agent that calls the same tool seven times in a chain where it previously called it twice is exhibiting anomalous behavior regardless of whether the final output appears correct.
Prompt lineage tracking. Every model call should record the prompt template version, the model version, and the key retrieval context identifiers used to construct the prompt. When an output quality regression occurs, prompt lineage data makes it possible to identify precisely which change caused the regression: was it the prompt template modification deployed on Tuesday, the model version upgrade on Thursday, or the knowledge base refresh on Friday?
Context window utilization tracking. As retrieval systems grow more complex, context windows fill with retrieved content of varying relevance. Tracking what fraction of the context window is consumed by high-relevance versus low-relevance retrieved content provides signal about retrieval quality degradation independent of output quality scoring.
Tracing Across Agent Hops
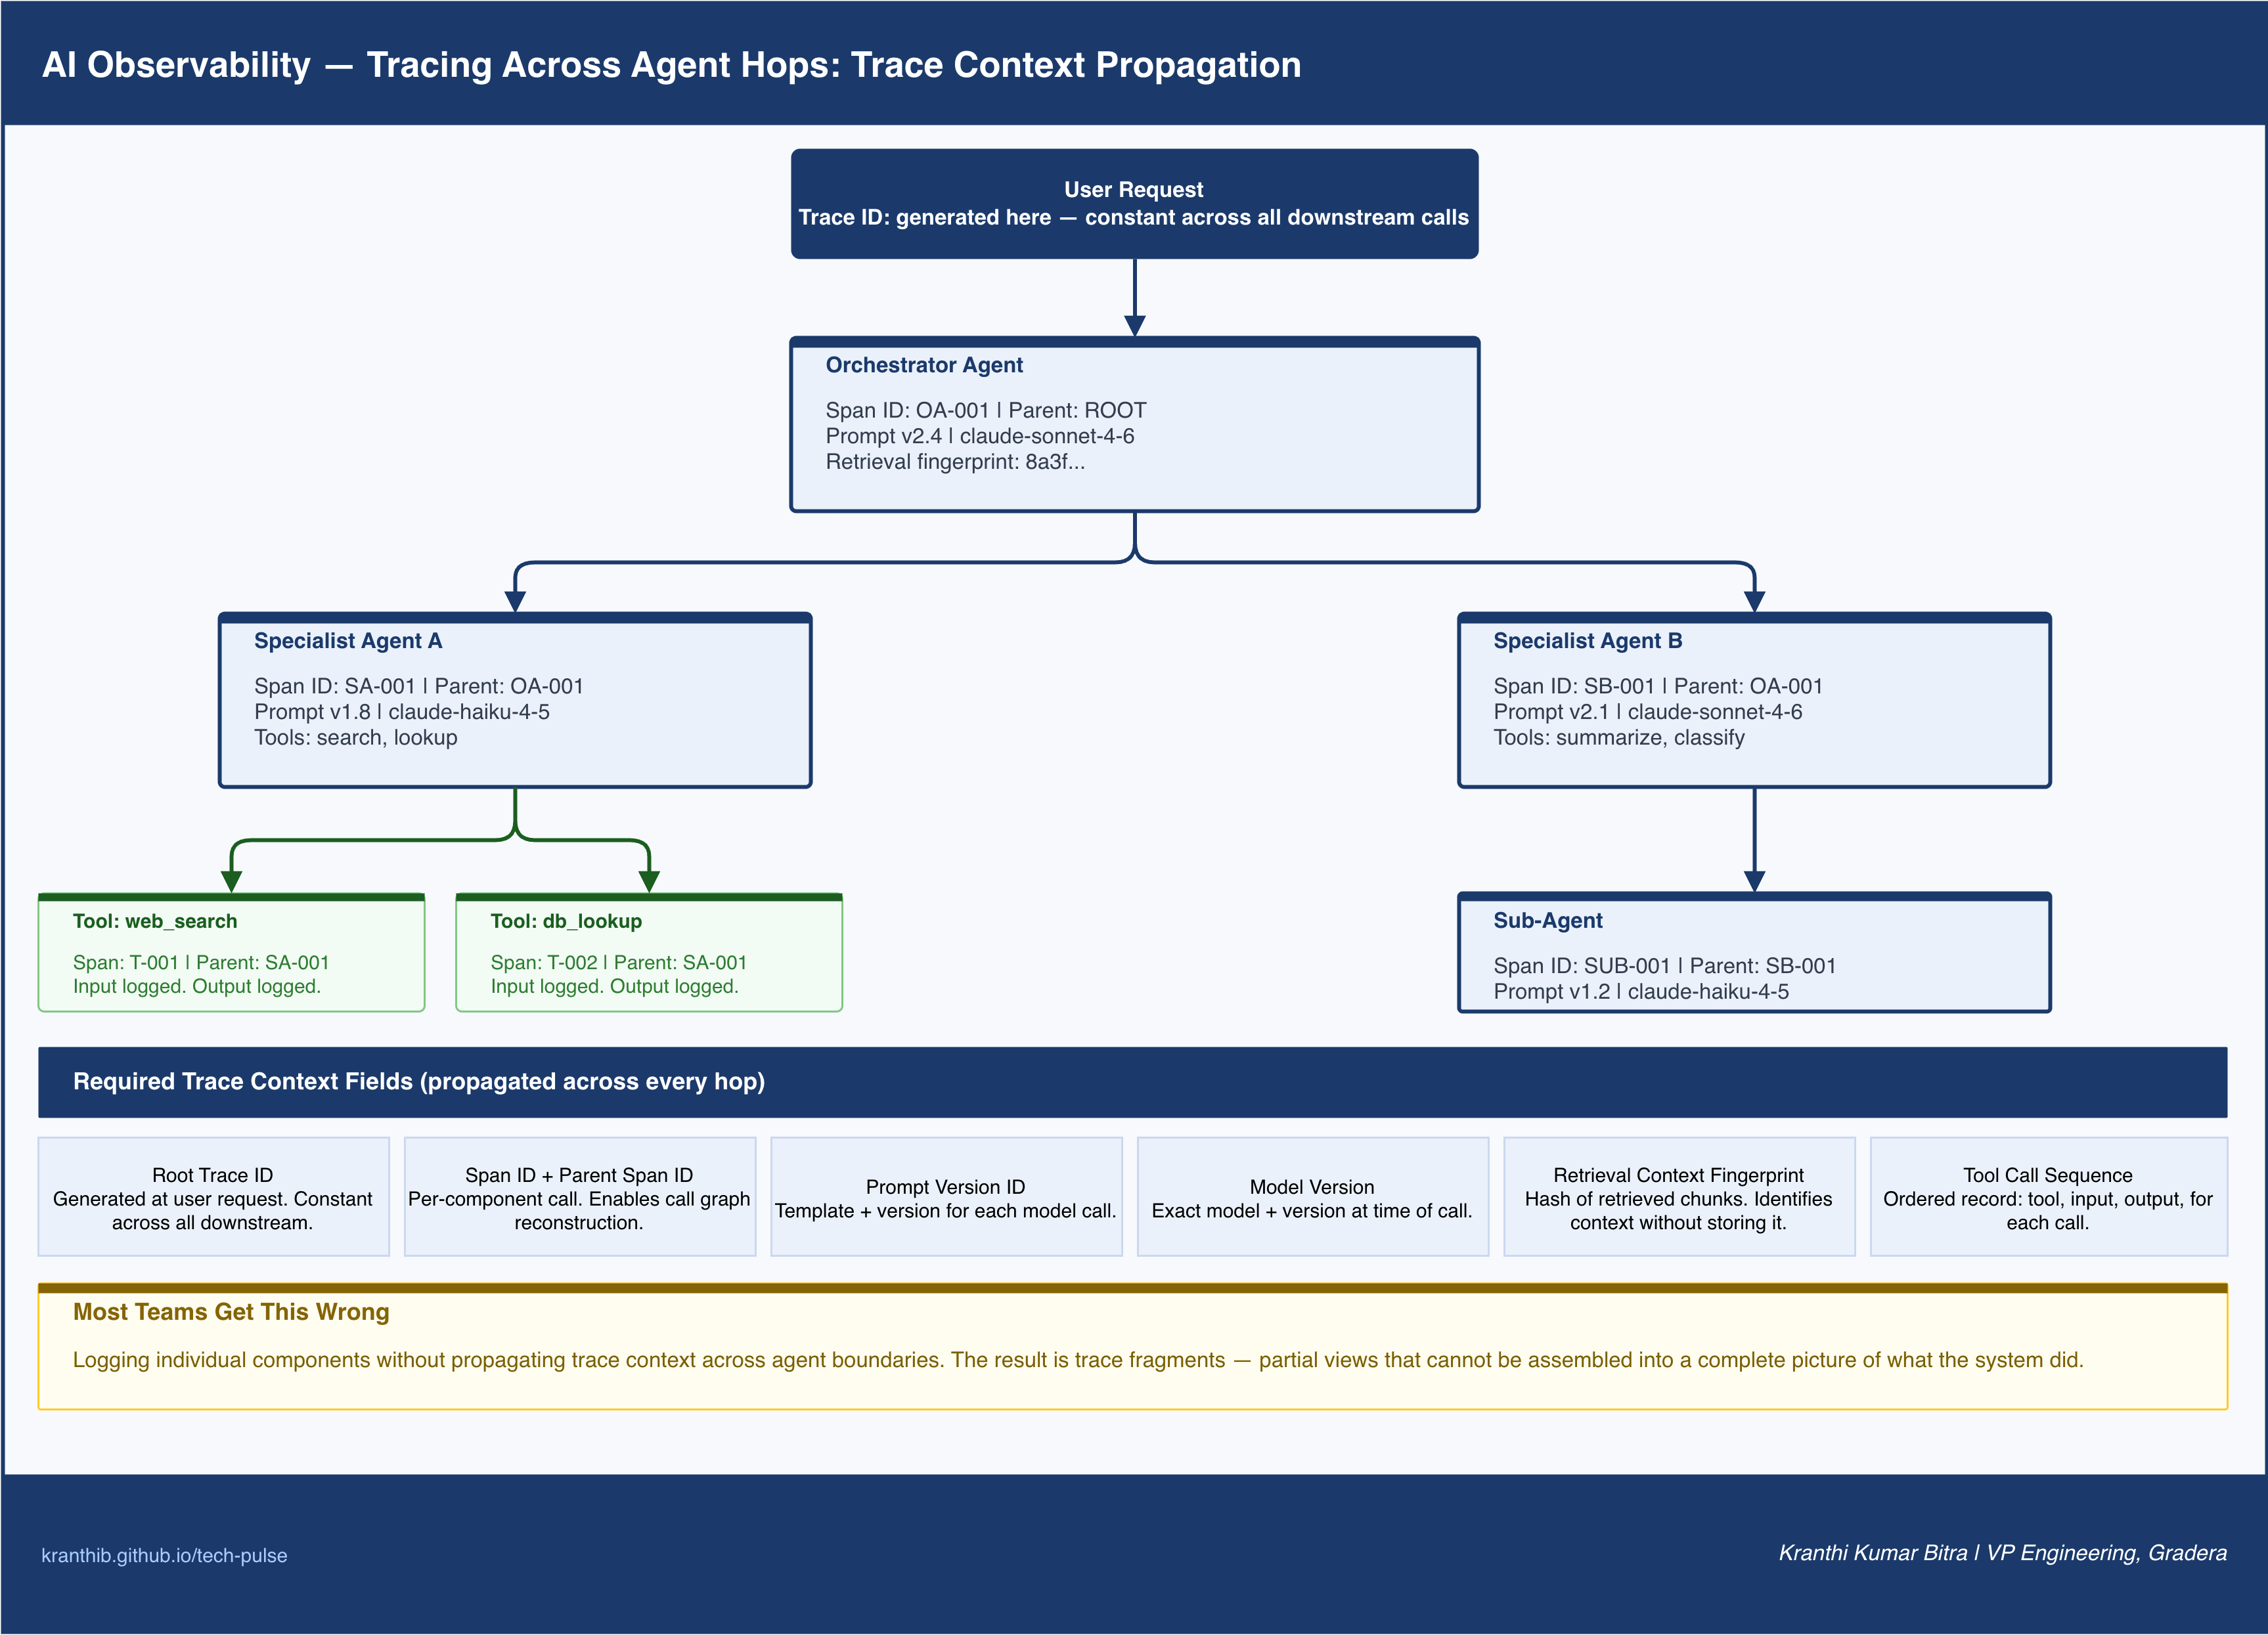
The multi-agent architecture introduces a tracing problem that single-model systems do not have. When a user request triggers an orchestrator agent, which calls a specialist agent, which calls three tools and one sub-agent, and the sub-agent calls two more tools — the resulting execution graph spans six or more discrete AI components. Understanding which component produced a failure requires trace context that propagates across every hop.
The standard approach is to propagate a trace context header, analogous to distributed tracing in microservice architectures, but with AI-specific additions.
A complete AI trace context record includes:
- Root trace ID. Generated at the point of initial user request. Remains constant across all downstream calls. Maps all activity in a user session to a single parent.
- Span ID. Generated for each individual AI component call. Records the specific operation within the broader trace.
- Parent span ID. Links each span to its parent, enabling reconstruction of the full call graph.
- Prompt version ID. The specific template and version used to construct this model call.
- Model version. The exact model and version called.
- Retrieval context fingerprint. A hash of the retrieved context chunks provided to the model. Enables deterministic identification of the retrieval context even when the chunks themselves are large.
- Tool call sequence. Ordered record of each tool called within this span, with input and output recorded.
When this trace context is propagated correctly, the full execution graph of any user request can be reconstructed after the fact. The diagnostic path for a reported failure becomes: retrieve the trace ID from the user report, fetch the full execution graph, identify which component introduced the failure, and examine the specific inputs and retrieved context for that component.
Most teams building multi-agent systems in 2026 are not doing this. They instrument the outer request with a request ID and log individual component calls, but they do not propagate the trace context across agent boundaries. The result is trace fragments: partial views of individual components that cannot be assembled into a coherent picture of what the system actually did.
The operational cost of missing trace propagation is asymmetric. In development, the missing context is annoying. In production, when a regulated output is challenged or a user-facing failure needs forensic investigation, missing lineage data is a compliance and engineering crisis simultaneously.
Semantic Drift Detection Framework
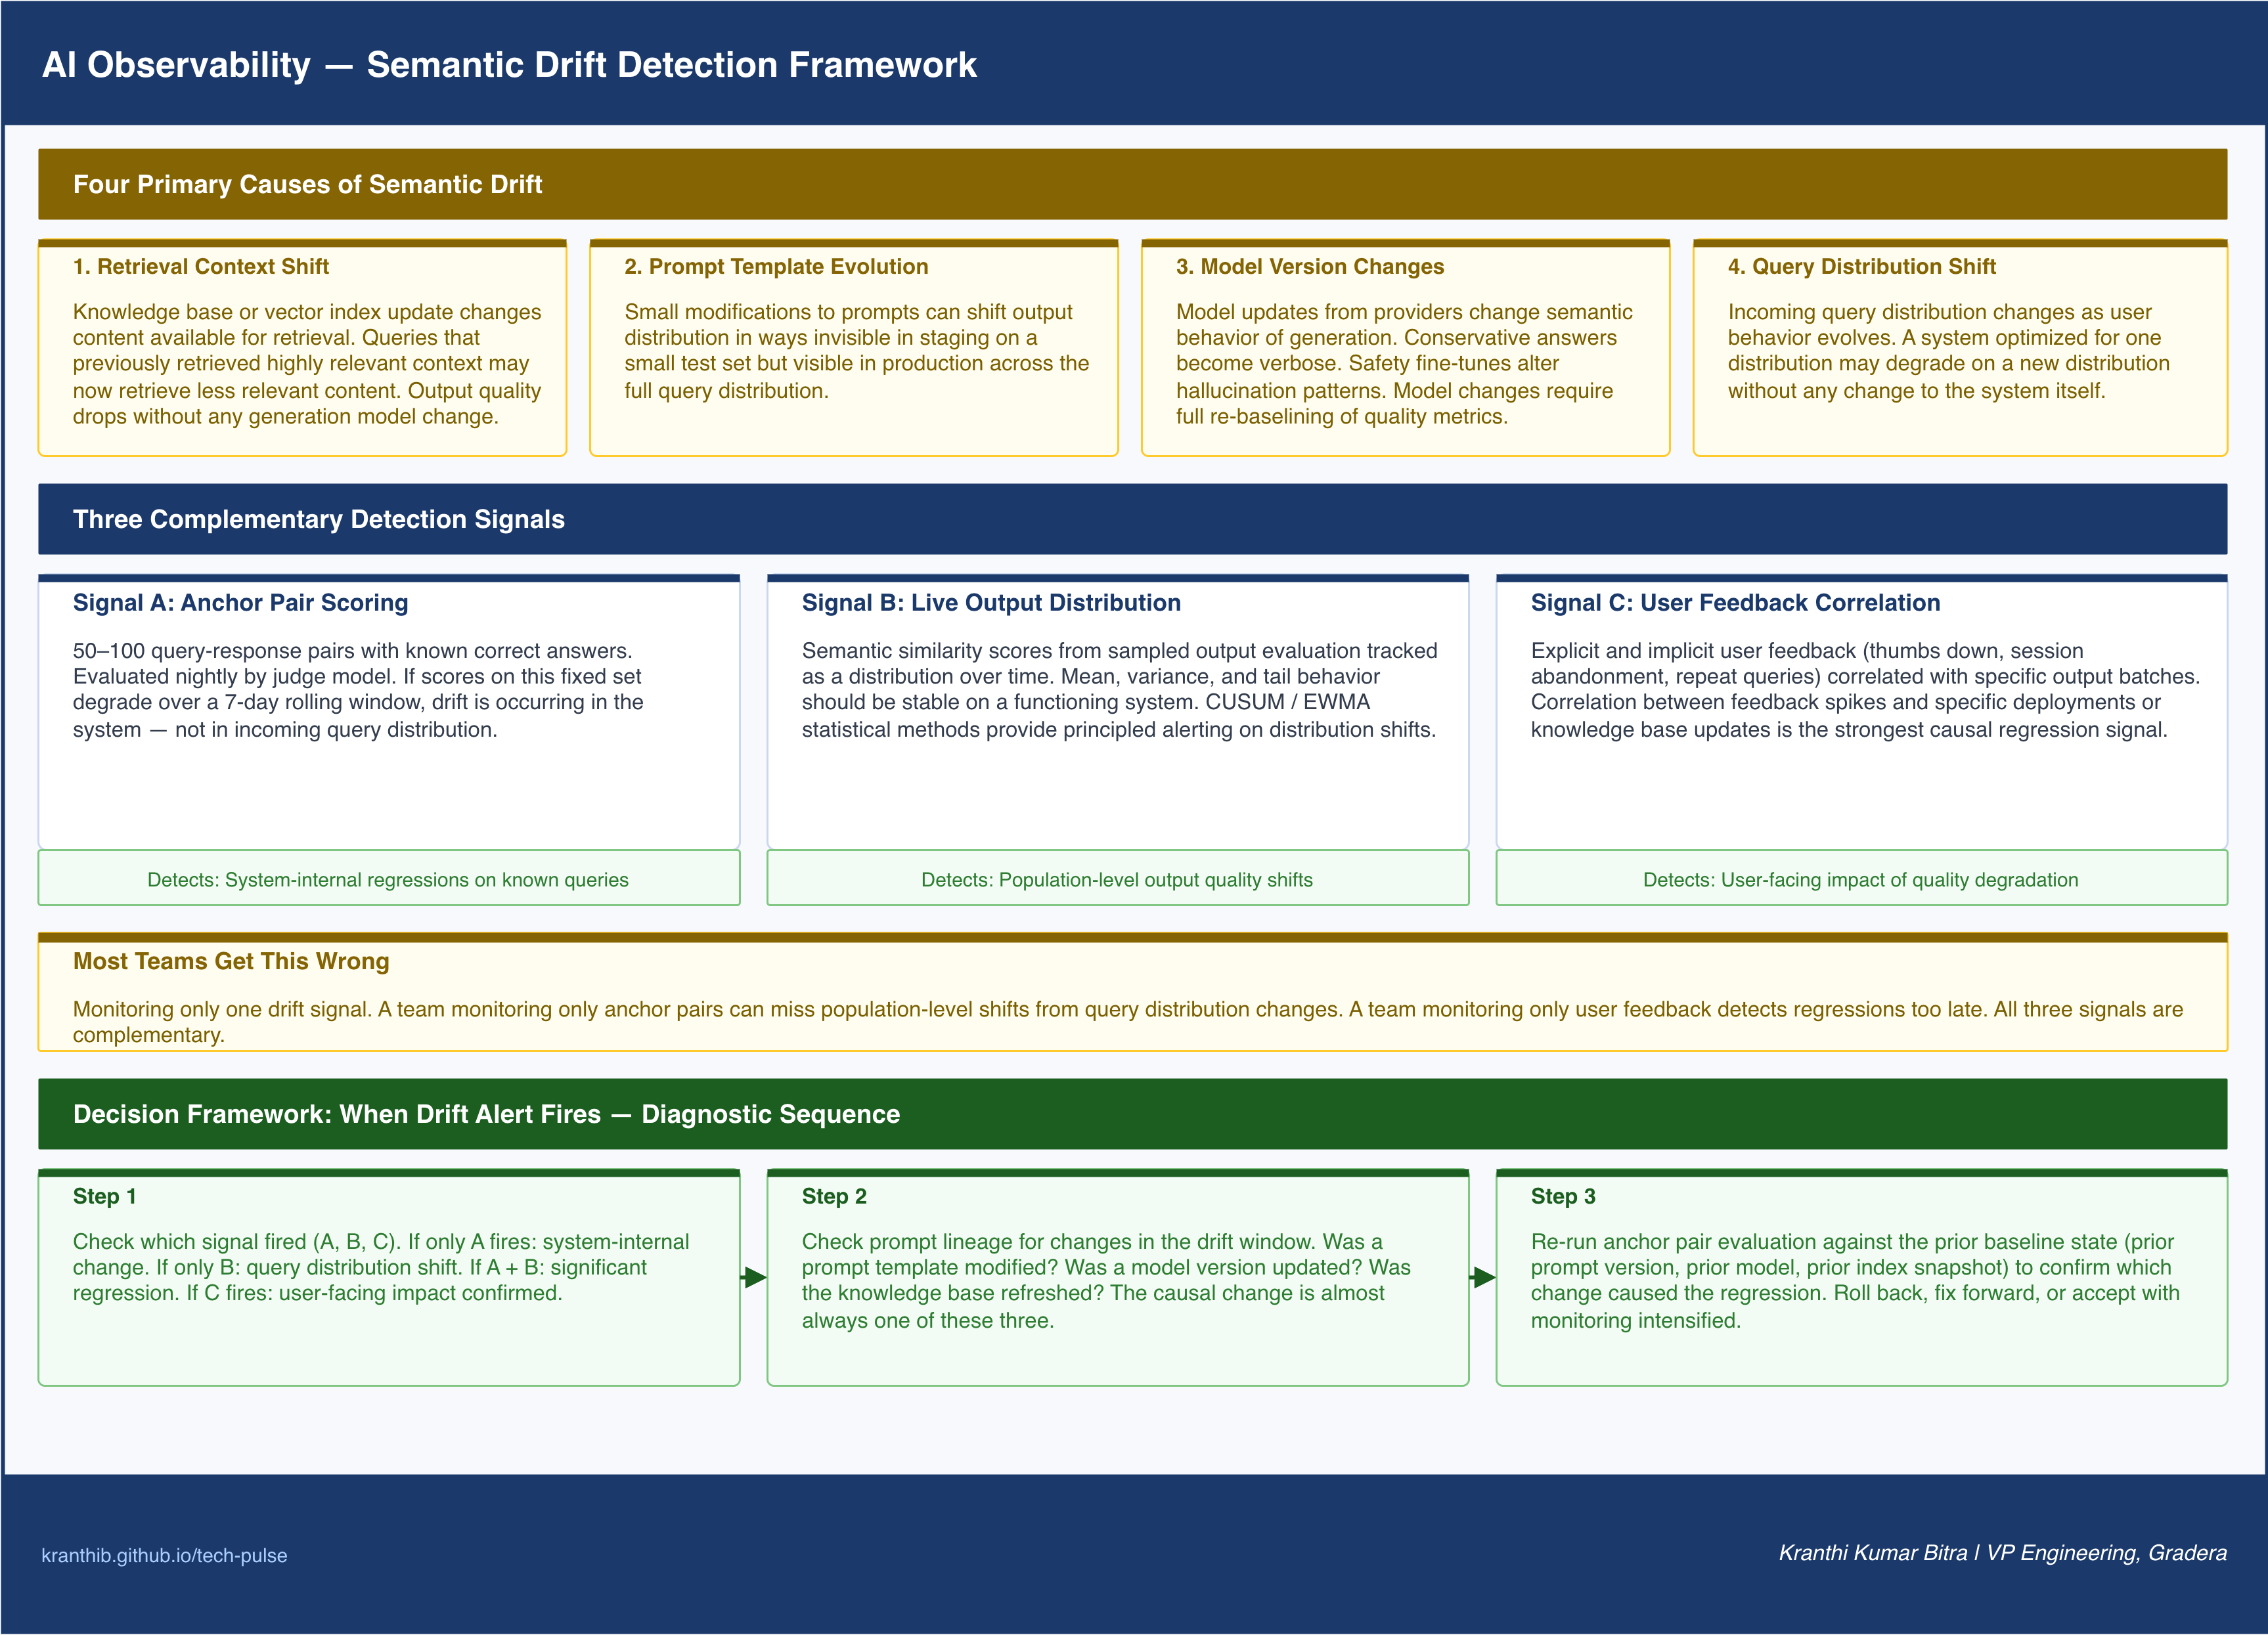
Semantic drift is the gradual degradation of output quality that occurs when the underlying components of an AI system change while the surface-level metrics remain stable. It is the most dangerous failure mode in production AI systems because it is invisible to traditional monitoring, slow enough to evade event-based alerting, and damaging enough to produce significant user-facing harm before detection.
Semantic drift has four primary causes:
1. Retrieval context shift. When the knowledge base or vector index is updated, the content available for retrieval changes. Queries that previously retrieved highly relevant context may now retrieve less relevant content after a knowledge base refresh, expansion, or re-embedding pass with an updated model. Output quality drops without any change to the generation model or prompt.
2. Prompt template evolution. Small prompt modifications — adding a constraint, changing a tone instruction, adjusting a few words — can shift output distribution in ways that are invisible in staging on a small test set but visible in production across the full query distribution. Tracking the output distribution baseline before and after every prompt deployment surfaces these shifts.
3. Model version changes. Model updates from providers change the semantic behavior of generation. A model that produced conservative answers may become more verbose or more assertive after an update. A model whose faithfulness was high may exhibit different hallucination patterns after a safety fine-tune. Model version changes require re-baselining all quality metrics.
4. Query distribution shift. The distribution of incoming queries changes over time as user behavior evolves. A system optimized for one query distribution may degrade on a new distribution without any change to the system itself. Monitoring query cluster distributions and flagging emergence of new query types provides early warning.
The practical drift detection implementation I have found most effective in production operates on three signals simultaneously:
Signal A: Anchor pair scoring. A set of 50 to 100 query-response pairs with known correct answers, evaluated nightly using the judge model. If the judge scores on this fixed set degrade over any seven-day rolling window, drift is occurring in the system rather than in the incoming query distribution.
Signal B: Live output distribution monitoring. Semantic similarity scores from the sampled output evaluation pipeline, tracked as a distribution over time. The mean, variance, and tail behavior of this distribution should be stable on a functioning system. Statistical process control methods — CUSUM, EWMA — provide principled alerting on distribution shifts without requiring human-defined thresholds.
Signal C: User feedback correlation. Explicit and implicit user feedback signals — thumbs down, session abandonment, follow-up queries that indicate dissatisfaction — correlated with specific output batches. A correlation between feedback spikes and a specific prompt version deployment or knowledge base update is the strongest possible signal of a causal quality regression.
These three signals are complementary, not redundant. Signal A catches system-internal regressions on known queries. Signal B catches population-level output quality shifts. Signal C catches the user-facing impact of quality degradation. A team monitoring only one of these three has significant blind spots.
Alert Design for AI Systems
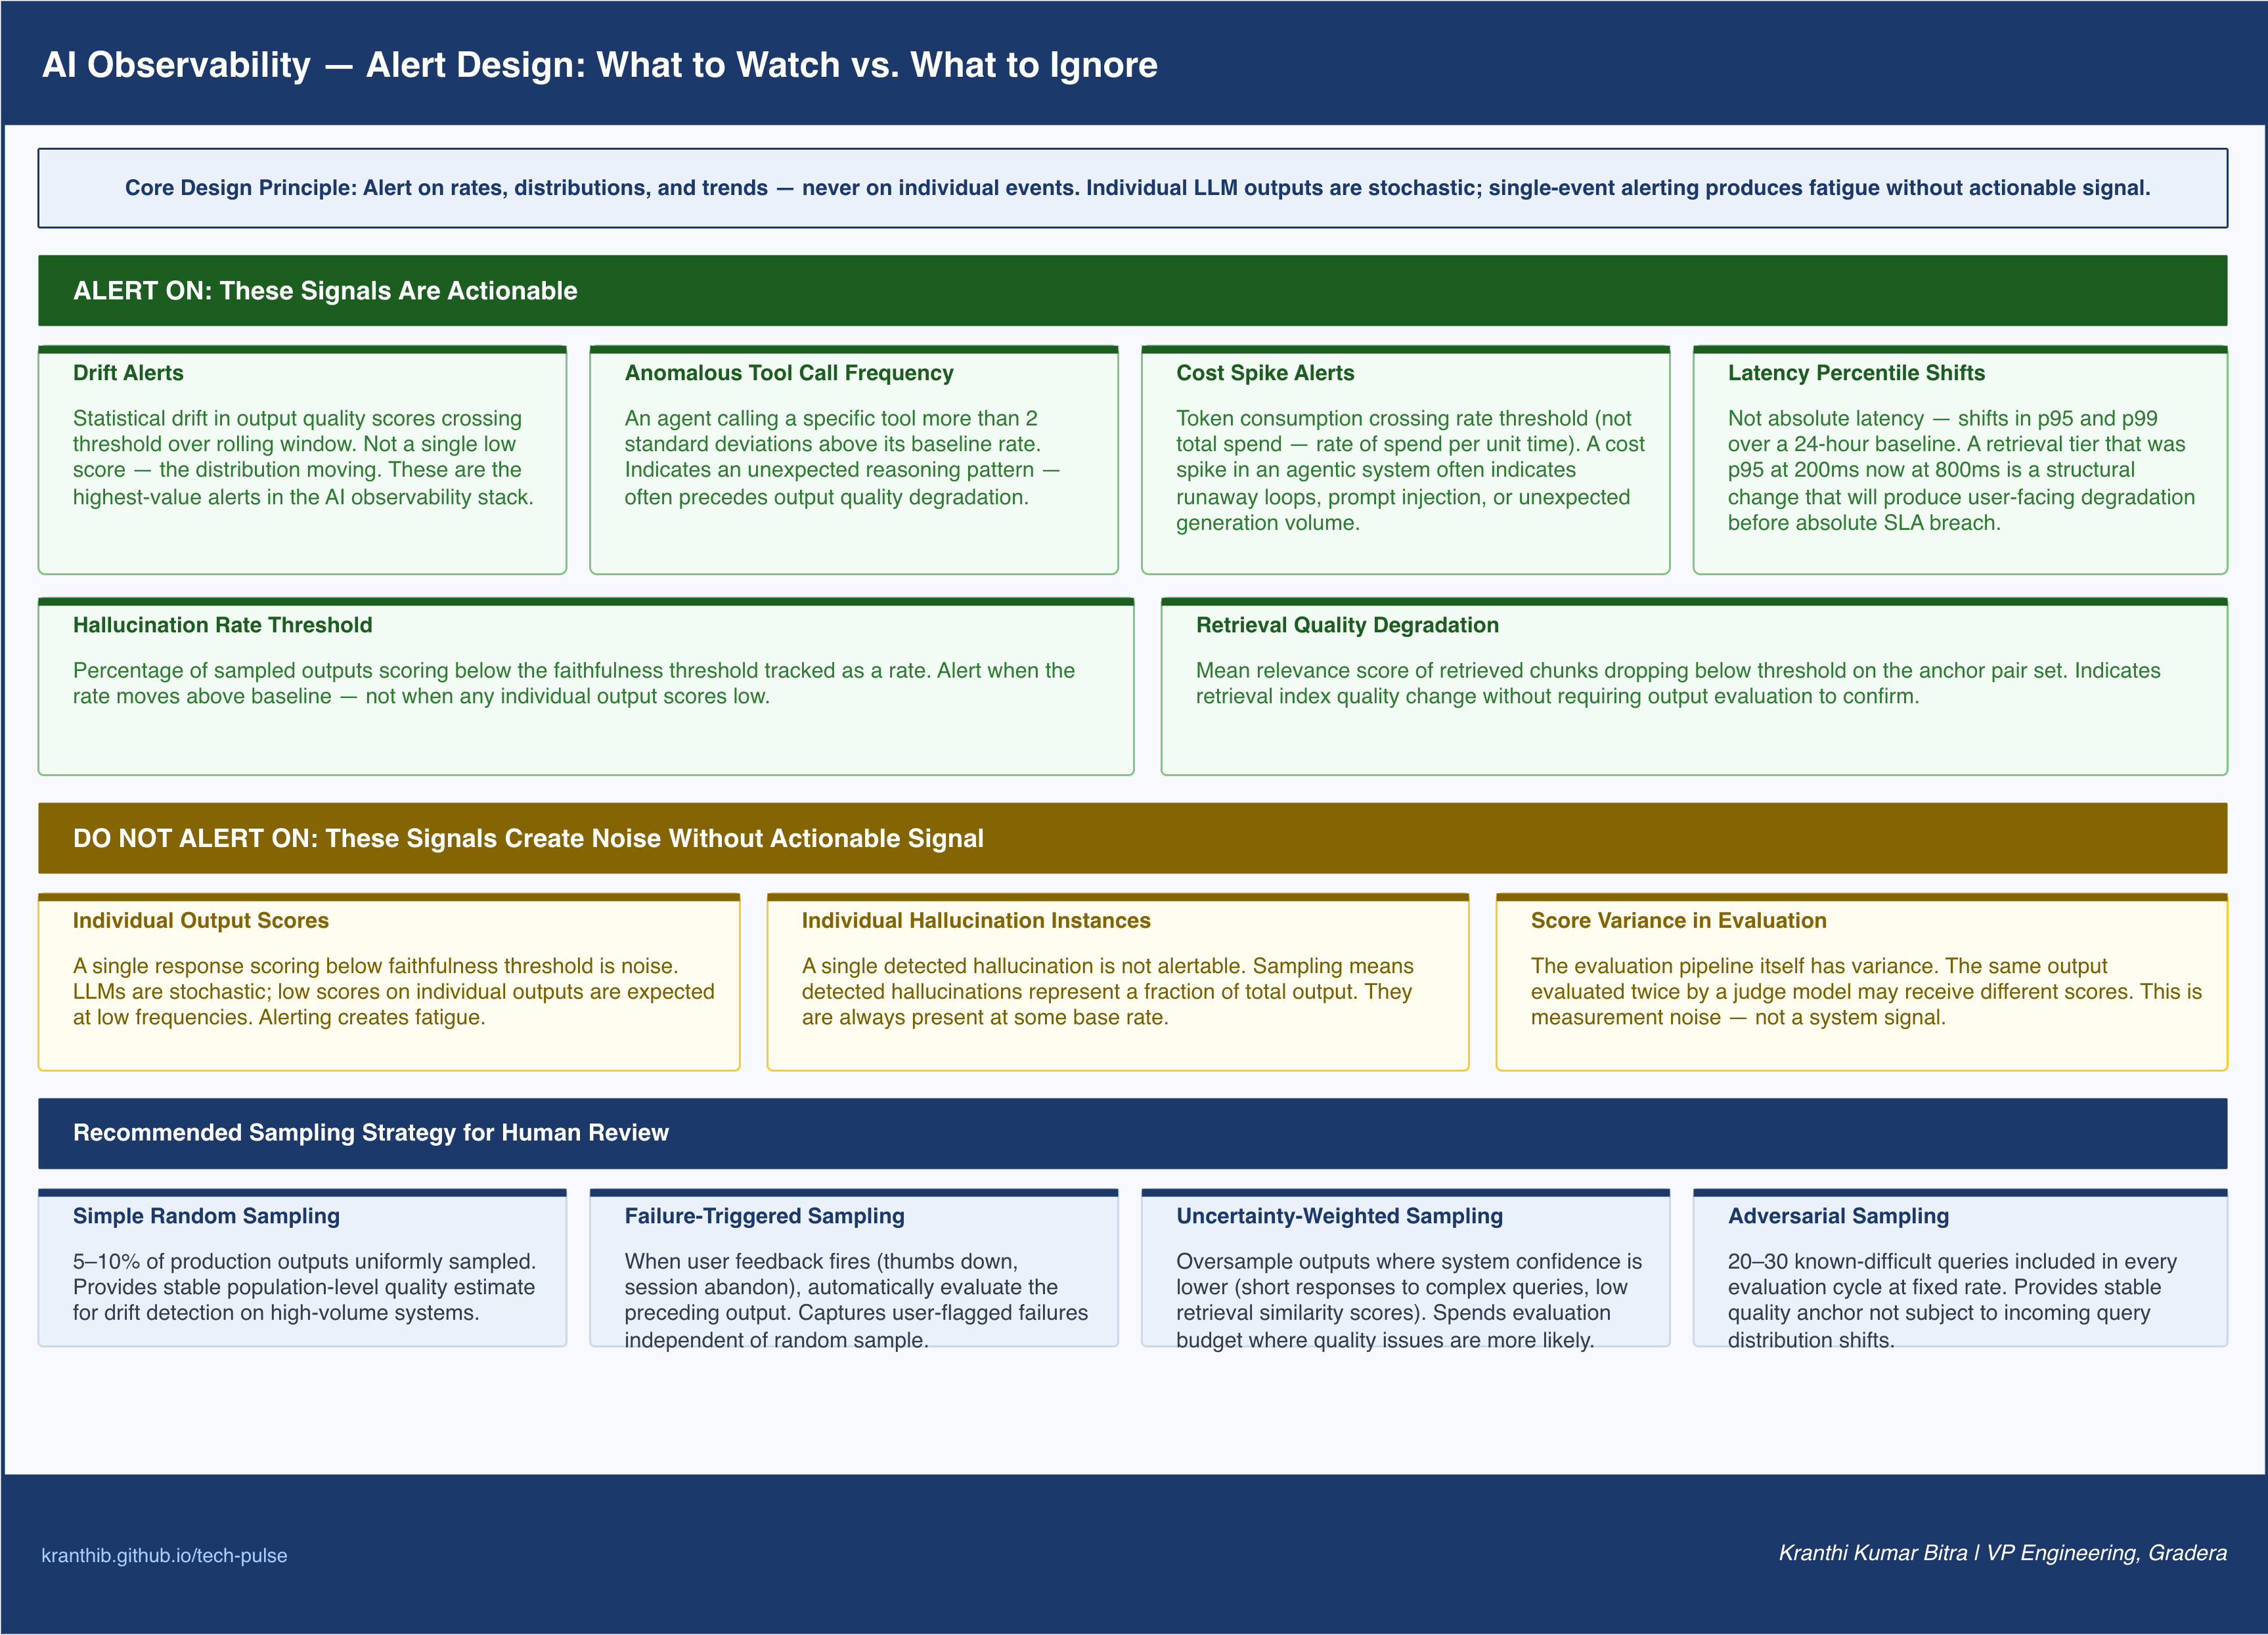
Alert design for AI systems requires different principles than alert design for traditional services. The primary distinction: in traditional systems, alerting on individual events is often correct — a single exception, a single failed health check, a single error response. In AI systems, alerting on individual events is almost always wrong and produces alert fatigue that degrades the entire monitoring practice.
What to alert on:
Drift alerts. Statistical drift in output quality scores crossing a defined threshold over a rolling window. Not a single low-scoring output — the distribution moving. These are the highest-value alerts in the AI observability stack.
Anomalous tool call frequency. An agent calling a specific tool more than two standard deviations above its baseline call rate. This is a behavioral signal that the agent is in an unexpected reasoning pattern.
Cost spike alerts. Token consumption crossing a rate threshold — not total spend, but rate of spend per unit time. A cost spike in an agentic system often indicates runaway loops, prompt injection, or input that is driving unexpected generation volume.
Latency percentile shifts. Not absolute latency, but shifts in p95 and p99 latency over a 24-hour baseline. A retrieval tier that was p95 at 200ms now at p95 at 800ms is a structural change that will produce user-facing degradation.
Hallucination rate crossing threshold. The percentage of sampled outputs scoring below the faithfulness threshold, tracked as a rate. Not individual low scores — the rate moving above baseline.
What not to alert on:
Individual output scores. A single response scoring below the faithfulness threshold is noise. LLMs are stochastic; low scores on individual outputs are expected at low frequencies. Alerting on individual scores produces alert fatigue without actionable signal.
Individual hallucination instances. A single detected hallucination is not alertable. The sampling strategy means detected hallucinations represent a fraction of total output. Alerting on individual instances creates a false sense that each one is exceptional when the reality is that they are always present at some base rate.
Score variance in evaluation. The evaluation pipeline itself has variance. The same output evaluated twice by a judge model may receive different scores. Alerting on evaluation variance confuses the measurement noise with the signal.
The design principle: alert on rates, distributions, and trends — not on individual events. This is operationally harder to implement and requires more sophisticated alerting infrastructure, but it is the only approach that produces signal without generating so much noise that the alerts become meaningless.
Sampling Strategies for Human Review
Semantic quality monitoring cannot evaluate 100% of production outputs in real time. The evaluation pipeline is asynchronous and resource-intensive; covering every output at scale is prohibitively expensive and architecturally unsound. The answer is principled sampling — selecting a fraction of outputs for evaluation in a way that provides statistically valid signal without reviewing everything.
Simple random sampling. The baseline approach: evaluate a fixed percentage of outputs, uniformly randomly selected. At 5% coverage on a system producing 10,000 responses per day, 500 outputs are evaluated daily. This provides a stable population-level quality estimate and is sufficient for drift detection on high-volume systems.
Stratified sampling. Sample proportionally from defined strata: query types, user segments, model versions, or time periods. Ensures that low-frequency but high-importance query types are not underrepresented in the evaluation sample.
Uncertainty-weighted sampling. Use a lightweight proxy model or heuristic to identify outputs where the system’s own confidence is lower — shorter responses to complex queries, high entropy in the response distribution, low retrieval similarity scores — and oversample from these. The logic: uncertain outputs are more likely to contain quality issues. Spending evaluation budget on uncertain outputs is more efficient than uniform random sampling.
Failure-triggered sampling. When an implicit feedback signal fires — user thumbs-down, immediate re-query on the same topic, session abandonment — automatically evaluate the output that preceded the signal. This ensures the evaluation pipeline captures user-flagged failures regardless of the random sample.
Adversarial sampling. Maintain a set of known-difficult queries — adversarial inputs, edge cases, historically problematic patterns — and include them in every evaluation cycle at a fixed inclusion rate. These anchor inputs provide a stable quality signal that is not subject to incoming query distribution shifts.
The practical recommendation for most production systems: start with simple random sampling at 5-10%, add failure-triggered sampling for all user feedback events, and add adversarial sampling with 20-30 anchor queries evaluated on every cycle. This combination provides stable population estimates, captures user-flagged failures, and maintains a fixed quality anchor that enables genuine trend analysis.
Dashboard Design for AI Systems
An AI observability dashboard serves two audiences with different information needs, and designing for both simultaneously produces a cluttered, unusable dashboard that serves neither.
The engineering leader view needs four indicators: output quality trend (is the system getting better or worse over the last 30 days?), cost efficiency (cost per 1,000 outputs, trending up or down?), user satisfaction correlation (are quality metrics and user feedback moving together or diverging?), and maturity level (where are we against the five-level model, and what is the gap to the next level?). This view should fit on a single screen, update daily, and be interpretable in 90 seconds.
The on-call engineer view needs operational signal: current quality scores versus baseline, active drift alerts, recent anomalous tool call patterns, sampling pipeline health, and the last 24 hours of infrastructure metrics with AI-specific overlays (token counts, model call breakdown, retrieval latency). This view is the incident response surface — it needs to answer “what is broken right now and where do I start?” within two minutes.
Building a single dashboard that serves both audiences means the engineering leader view gets cluttered with operational noise and the on-call view gets obscured by trend context. Two separate views, informed by the same underlying data, produce better outcomes for both.
The AI Observability Maturity Model
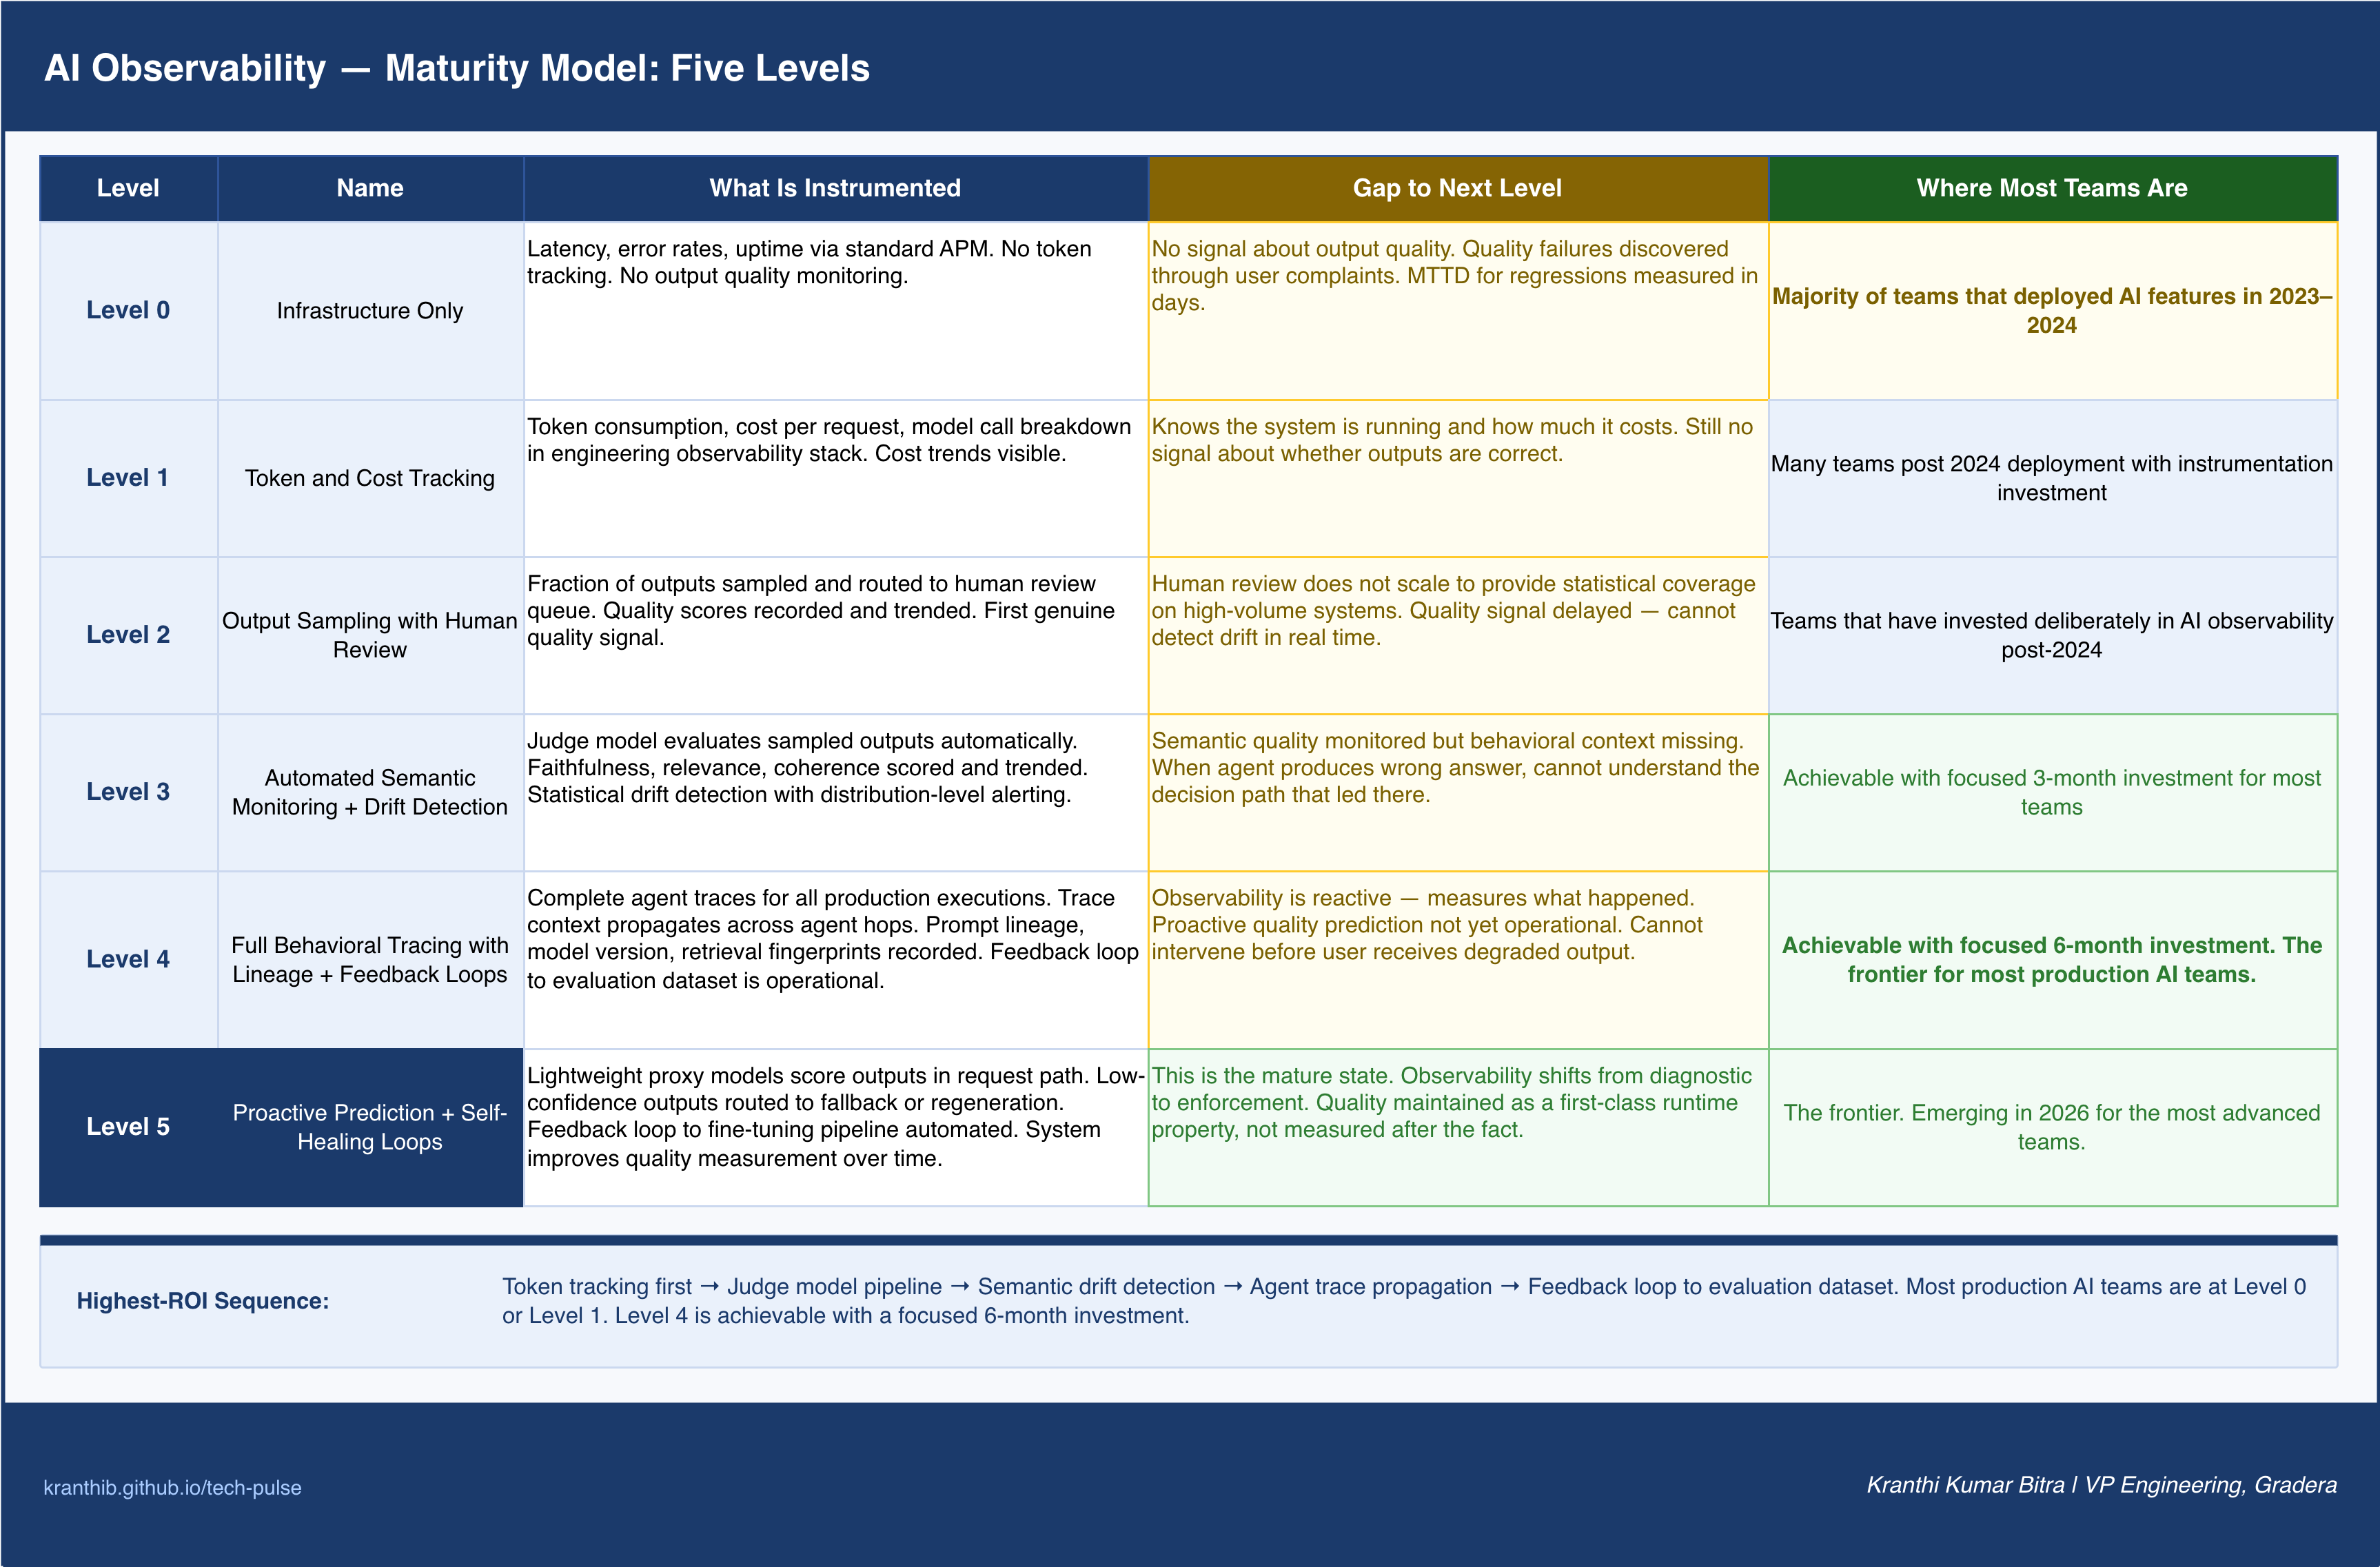
Across the teams I have worked with and advised, AI observability capability clusters into five distinct levels. Each level represents a coherent set of practices and instrumentation that teams typically advance through sequentially. Skipping levels is possible but usually means the skipped level’s gap surfaces later as a production incident.
Level 0: Infrastructure only. The team monitors latency, error rates, and uptime using standard APM tooling. No AI-specific instrumentation exists. Token usage is tracked on the billing dashboard, not in the engineering observability stack. Output quality monitoring does not exist. This describes the majority of teams that deployed AI features in 2023-2024.
Gap to Level 1: The team has no signal about output quality. Quality failures are discovered through user complaints. Mean time to detection for quality regressions is measured in days.
Level 1: Token and cost tracking. Token consumption, cost per request, and model call breakdown are instrumented in the engineering observability stack. The team knows which endpoints are most expensive, which model calls dominate cost, and whether token consumption is trending up or down. Infrastructure monitoring remains the primary quality signal.
Gap to Level 2: The team knows the system is running and how much it costs. It still has no signal about whether the outputs are correct.
Level 2: Output sampling with human review. A fraction of production outputs is sampled and routed to a human review queue. Domain experts or QA engineers evaluate sampled outputs against quality criteria. Quality scores are recorded and trended over time. This is the first level at which a team has a genuine quality signal — but it is slow (review latency in hours to days), expensive (requires human reviewer time at scale), and not scalable beyond a small fraction of outputs.
Gap to Level 3: Human review is valuable but cannot scale to provide statistical coverage on high-volume systems. Quality signal is delayed relative to the need for real-time drift detection.
Level 3: Automated semantic quality monitoring with drift detection. A judge model evaluates sampled outputs automatically. Faithfulness, relevance, and coherence scores are computed out-of-band and written to a time-series store. Statistical drift detection runs continuously over the score distributions. Alerts fire on distribution shifts rather than individual events. This is the first level at which a team can detect quality regressions before they surface in user feedback on high-volume systems.
Gap to Level 4: Semantic quality is monitored, but behavioral context is missing. When an agent produces a wrong answer, the team can see the output quality score but cannot understand why the agent made the decisions it made.
Level 4: Full behavioral tracing with lineage. Complete agent traces are captured for all production executions. Trace context propagates across agent hops, tool calls, and memory retrievals. Prompt lineage, model version, and retrieval context fingerprints are recorded for every output. The feedback loop from production quality signals to evaluation dataset expansion is operational. When a quality regression occurs, the team can identify the specific change that caused it within hours, not days.
Gap to Level 5: Observability is reactive — it measures what has happened. Proactive quality prediction is not yet operational.
Level 5: Proactive quality prediction and self-healing loops. The observability system predicts quality risk before outputs are delivered to users. Lightweight proxy models score query-response pairs in the request path and route low-confidence outputs to enhanced review pipelines or fallback behaviors. The feedback loop from production signal to evaluation dataset and fine-tuning pipeline is automated. The system improves its own quality measurement over time as production data accumulates.
Most teams in production AI today are at Level 0 or Level 1. Teams that have invested deliberately in AI observability are at Level 2 or Level 3. Level 4 is achievable for most teams with a focused six-month investment. Level 5 is the frontier.
The Feedback Loop: Closing the Production-to-Training Gap
The full value of production observability is only realized when the signal it generates flows back into the system that produced the outputs. This feedback loop is the mechanism by which production AI systems improve over time rather than degrading.
The loop has four stages:
Stage 1: Signal collection. Production outputs are sampled, evaluated by the judge model, and scored. User feedback events are captured and correlated with specific outputs. Anomalous agent behaviors are flagged by behavioral monitoring. All of this signal is written to a structured evaluation store.
Stage 2: Dataset construction. Outputs that scored below quality thresholds, outputs that triggered user negative feedback, and outputs that exhibited anomalous agent behavior are candidates for evaluation dataset expansion. Domain experts review flagged outputs to confirm they represent genuine quality failures and annotate the correct behavior. The annotated examples enter the evaluation dataset.
Stage 3: Evaluation and regression detection. The expanded evaluation dataset runs in the CI/CD pipeline on every prompt or model change. Regressions on examples derived from production failures are blocked. This ensures that production failures, once discovered, cannot recur through a code change.
Stage 4: Fine-tuning pipeline feed. For teams with the infrastructure to fine-tune or continuously train their models, the annotated failures provide high-signal examples of the behaviors the model should not produce. Production failures, properly annotated, are more valuable than synthetically generated training examples because they represent real user queries and real failure modes.
The feedback loop is what distinguishes a static deployed model from a learning production system. Without it, the observability investment produces diagnostics but not improvement. With it, each production quality failure makes the system measurably more robust against that class of failure in the future.
What Most Teams Get Wrong
Treating LLM calls like API calls. The single most common mistake is instrumenting LLM calls the same way as REST API calls: record the request, record the response, check the status code, measure the latency. This treats the LLM as a deterministic service with a binary success/failure signal. A REST API call that returns a wrong answer throws an exception or returns an error code. An LLM call that produces a wrong answer returns HTTP 200 with a well-formatted, confidently phrased, plausible incorrect response. The monitoring strategy must account for the structural difference between failure and incorrectness.
Alerting on individual outputs instead of distributions. Teams that have made progress beyond infrastructure monitoring often over-correct by alerting on individual low-scoring outputs. This produces alert fatigue immediately: at any non-trivial volume, the stochastic nature of LLM evaluation means that low-scoring individual outputs are constant background noise. The discipline of AI observability is distribution-level thinking: the question is never “did this specific output score badly?” but “is the distribution of output scores shifting?”
Evaluating outputs with the same model that produced them. Using the generation model as the judge model is a self-validation trap. The model rates its own outputs as correct because it is pattern-completing against its own generation. Faithfulness scores in the 0.90-0.95 range on outputs that contain significant hallucination are the predictable result. Judge model selection must be independent — different provider, different fine-tune, different scale.
Building observability last. Teams treat observability as the thing that gets added after the feature works. For AI systems, this sequencing is particularly costly because the evaluation dataset, the baseline metrics, and the judge model pipeline need to be established before production traffic arrives in order to have a meaningful baseline to compare against. Observability built after deployment starts with no baseline and must establish one retroactively under operational pressure.
Skipping agent trace propagation in multi-agent systems. In single-model systems, missing trace context means losing diagnostic context for individual requests. In multi-agent systems, missing trace context means losing the ability to understand which agent in a six-hop chain produced the failure. The debugging cost of investigating a multi-agent failure without complete trace propagation is an order of magnitude higher than the implementation cost of building trace propagation correctly at the start.
Where This Is Heading
AI observability as a discipline is at roughly the stage that distributed systems observability was in 2016. The core concepts are established; the tooling ecosystem is maturing rapidly; the teams that invest now will have a compounding advantage as agentic systems grow more complex.
Three developments are converging in 2026 and 2027 that will reshape AI observability practices:
Real-time semantic quality gates in the request path. The current architecture separates quality evaluation from the request path for latency reasons. Advances in lightweight proxy models are reducing evaluation latency to the point where real-time quality gating becomes feasible: a small model evaluates the output in the request path and either passes it through, routes it to a fallback, or requests regeneration. This shifts AI observability from a diagnostic tool to a quality enforcement layer.
Cross-system agent identity and behavior correlation. As agents from different systems interact through A2A protocols, observability must track behaviors across organizational boundaries. An agent that behaves correctly in isolation but adversarially when interacting with another organization’s agent represents a failure mode that no single-system observability stack can detect. Federated behavioral monitoring across agent interaction boundaries will become a requirement for any production multi-agent architecture.
Automated evaluation dataset evolution. Today, expanding the evaluation dataset requires human annotation of production failures. Advances in synthetic annotation — using strong judge models to automatically annotate failures and verify annotations through multi-model consensus — will reduce the human review requirement while maintaining annotation quality. The feedback loop from production signal to evaluation improvement will become faster and less labor-intensive.
The teams that treat AI observability as infrastructure today — not as a post-deployment add-on, not as a compliance checkbox, but as the engineering discipline that makes production AI systems trustworthy — will be positioned to operate reliably as the failure surface expands with agent complexity.
The teams that are still measuring latency and uptime will keep discovering quality failures through user complaints.
Decision Framework: Where to Start
If your team is at Level 0 or Level 1, the path to meaningful AI observability does not require implementing everything at once. The highest-ROI sequence:
-
First: Instrument token and cost tracking (Level 1, one sprint). This provides immediate operational value and surfaces cost anomalies that indicate structural issues before they become quality problems.
-
Second: Build the judge model pipeline and start sampling (Level 2-3, two to three sprints). Stand up an async evaluation pipeline, sample 5% of production outputs, route through a judge model, and write scores to a time-series store. This is the first genuine quality signal. Baseline everything immediately.
-
Third: Add semantic drift detection (Level 3, one sprint). Once you have a baseline of quality scores, add rolling window statistical drift detection against that baseline. This converts the evaluation pipeline from a diagnostic tool into an alerting system.
-
Fourth: Implement agent trace propagation (Level 4, two to three sprints for complex agentic systems). Design trace context propagation across agent boundaries and tool calls. Build the lineage schema that records prompt version, model version, and retrieval context fingerprint.
-
Fifth: Close the feedback loop (Level 4, ongoing). Build the pipeline from flagged production outputs to evaluation dataset expansion. This converts observability from pure diagnostics into continuous improvement.
Each stage delivers value independently. You do not need to complete all five to improve on your current posture. The most important step is the first one: acknowledging that measuring latency and error rates is not observability for AI systems, and committing to building the layer that actually measures correctness.
The teams that will catch AI failures before users do are the ones building observability as infrastructure, not as an afterthought.